
A low water history of Megunticook Lake
 Fall of 2020 showing the lake level at approximately three feet below the East Dam spillway. That was almost a foot lower than in September of 2026. (Photo by Alison McKellar)
Fall of 2020 showing the lake level at approximately three feet below the East Dam spillway. That was almost a foot lower than in September of 2026. (Photo by Alison McKellar)
Fall of 2020 showing the lake level at approximately three feet below the East Dam spillway. That was almost a foot lower than in September of 2026. (Photo by Alison McKellar)It is the time of year when most of Maine's lakes and ponds are at their yearly low water level and it seems like just about every year at this time someone tells me they fear that Megunticook Lake is as low as it has ever been. Everyone has an opinion about where the water should be, and it seems that most remember it always being like that. But the truth is that Megunticook is a lake of highs and lows—although less so in recent years.
Search the Camden Herald archives for phrases like “lake level” or “water level” and you will be treated to 150 years of massive annual fluctuations in the level of Megunticook Lake and River and arguments between residents, mill owners, and environmental agencies over where the water should or shouldn't flow. Water wars are somewhat of a Camden tradition.
As soon as I was elected to the Select Board, I started hearing opinions from people living on the lake and the river about the way things had always been and the way things are supposed to be when it comes to water levels and dam management. Sometimes the water is too high and sometimes too low, and believe it or not, sometimes the lake has been both too high and too low on the same day.
But in general, the end of summer/beginning of fall means the lake level is dropping to its lowest levels of the year just in time for hurricane season, helping to provide some buffering and flood protection. If it doesn't drop on its own, the policy for many years has been to bring it down proactively to prevent flooding, but it can be hard to anticipate when the rain will come.
This year, the typical cycle of high water in the spring and low water in the fall is compounded by the fact that all of Maine is officially in a drought (categorized as severe in the midcoast). According to the National Weather Service, July ranked as the 3rd driest July on record statewide.
So then it's no surprise that Megunticook Lake is getting a little low and hasn't needed any help getting down low enough to prepare for hurricanes. The outlet gate has been set to minimum flow for the entire season and Mother Nature has been slowly bringing the level down.
At the time of this writing, the water level is 27 inches below the spillway of the East Dam, which most would consider a little lower than desirable, but it's actually a little higher than it often is at this time of year.
The table below shows the median mid-late September readings. Every fall, the water comes down, usually to the point where some start wondering whether it will recover, and each Spring—and often before—it comes right back up. Sometimes it comes up too much.
This year's severe drought is putting us slightly on the lower side of recent history for this time of year but only by the smallest of margins.
| Period | Mid-September median | End-of-September median |
|---|---|---|
| 1979–1995 | 25.″ below | 29.″ below |
| 2015–2025 | 23″ below | 27″ below |
And then here are some of the annual lowest readings from the compiled data I've been able to track down:
| Year | Lowest level | Year | Lowest level |
|---|---|---|---|
| 1978 | 86″ below | 2015 | 32″ below |
| 1979 | 42″ below | 2016 | 36″ below |
| 1980 | 36″ below | 2017 | 35.5″ below |
| 1981 | 36″ below | 2018 | 31″ below |
| 1982 | 46″ below | 2019 | 29″ below |
| 1983 | 30″ below | 2020 | 39″ below |
| 1984 | 50″ below | 2021 | 29″ below |
| 1985 | 33″ below | 2022 | 29″ below |
| 1986 | 30″ below | 2023 | 27″ below |
| 1987 | 31″ below | 2024 | 38″ below |
| 1988 | 46.5″ below | 2025 | 38″ below |
| 1989 | 35.5″ below | ||
| 1990 | 31″ below | ||
| 1991 | 24.75″ below | ||
| 1992 | 34.5″ below | ||
| 1993 | 34″ below | ||
| 1994 | 31″ below |
During my initial conversations with residents along the lake and river, about a decade ago when I was first elected to the Select Board and started hearing from people, I was often told about Ken Bailey and how well he used to manage the water level at the lake.
Ken—for those who don't know—is somewhat of a Camden folk hero, and for good reason. Among his many titles were police officer, Master Maine Guide, downtown business owner, dam control agent, Executive Director of the Megunticook Watershed Association, columnist and managing editor of the Camden Herald, Director of the Town of Camden Parks and Rec department — and, he even served two terms on the Camden Select Board.
It is rare for a town elected official or staff member to also be such a prolific and accomplished writer and we are lucky that Ken left so much of his experience documented. If anyone had a shot at keeping everyone happy all the time, it was Ken, and so I went looking for what he had written on the topic of water levels. He summed up the water level situation as well as anyone could back in 1984 when he was managing editor of the Camden Herald:
“You know the saying… you can’t please all of the people all of the time. Well, this spring and part of the early summer, people were complaining about the high water levels at Megunticook Lake and Norton Pond. Now with the water more than 4ft below the spillway at the outlet dam, others are saying the water is too low. And it is.”
Ken goes on to describe the impossibility of reaching unanimous agreement on what the water level should be as well as the difficulty in predicting the patterns of Mother Nature. In this instance, the lake had been drawn down lower in preparation for fall rains and hurricane season that never came. The main point of his editorial, though, was to remind everyone how much worse things could be if the privately owned water company were to take control of the water rights on the lake.
Ken was good at reminding people that things could be much worse. In November of 2001, he was serving as the town of Camden’s dam control agent and the water level had dropped to a little more than three feet below the spillway at the East Dam. Naturally, people were noticing that the lake looked low, and probably some of them were doing what they do and declaring it, “the lowest it’s ever been.”
Ken wrote an article in the November 15, 2001, edition titled “Megunticook Lake has seen lower days” where he went over some of the historical data available on lake levels. He referenced Charles C. Wood’s data from 1900-1947, which included only the reading from the first Sunday in November over the entire period. The lake averaged between five to six feet below the spillway on November 1 over a 47-year period.
In 1983, a few years earlier, Ken had delved into the threat facing the lake in the form of hydropower. A full page is dedicated to historical water levels and includes a map showing what the lake might look like if it were drawn down nine feet below the normal July level. On the same page, Dr. Ernest Marshall graphs out nearly 100 years of water level data at Megunticook Lake taken from the records of the Knox Mill Associates. In 1901, the lake fluctuated some 12.5 feet over the course of the year.
I've created a couple graphs to help visualize the information in different ways. They are autogenerated based on the spreadsheet created by the different handwritten sources I've photographed combined with a download of the town's available data on the Crowdwater platfrom. Please let me know if you can add to the dataset or if you see anything that needs to be corrected.
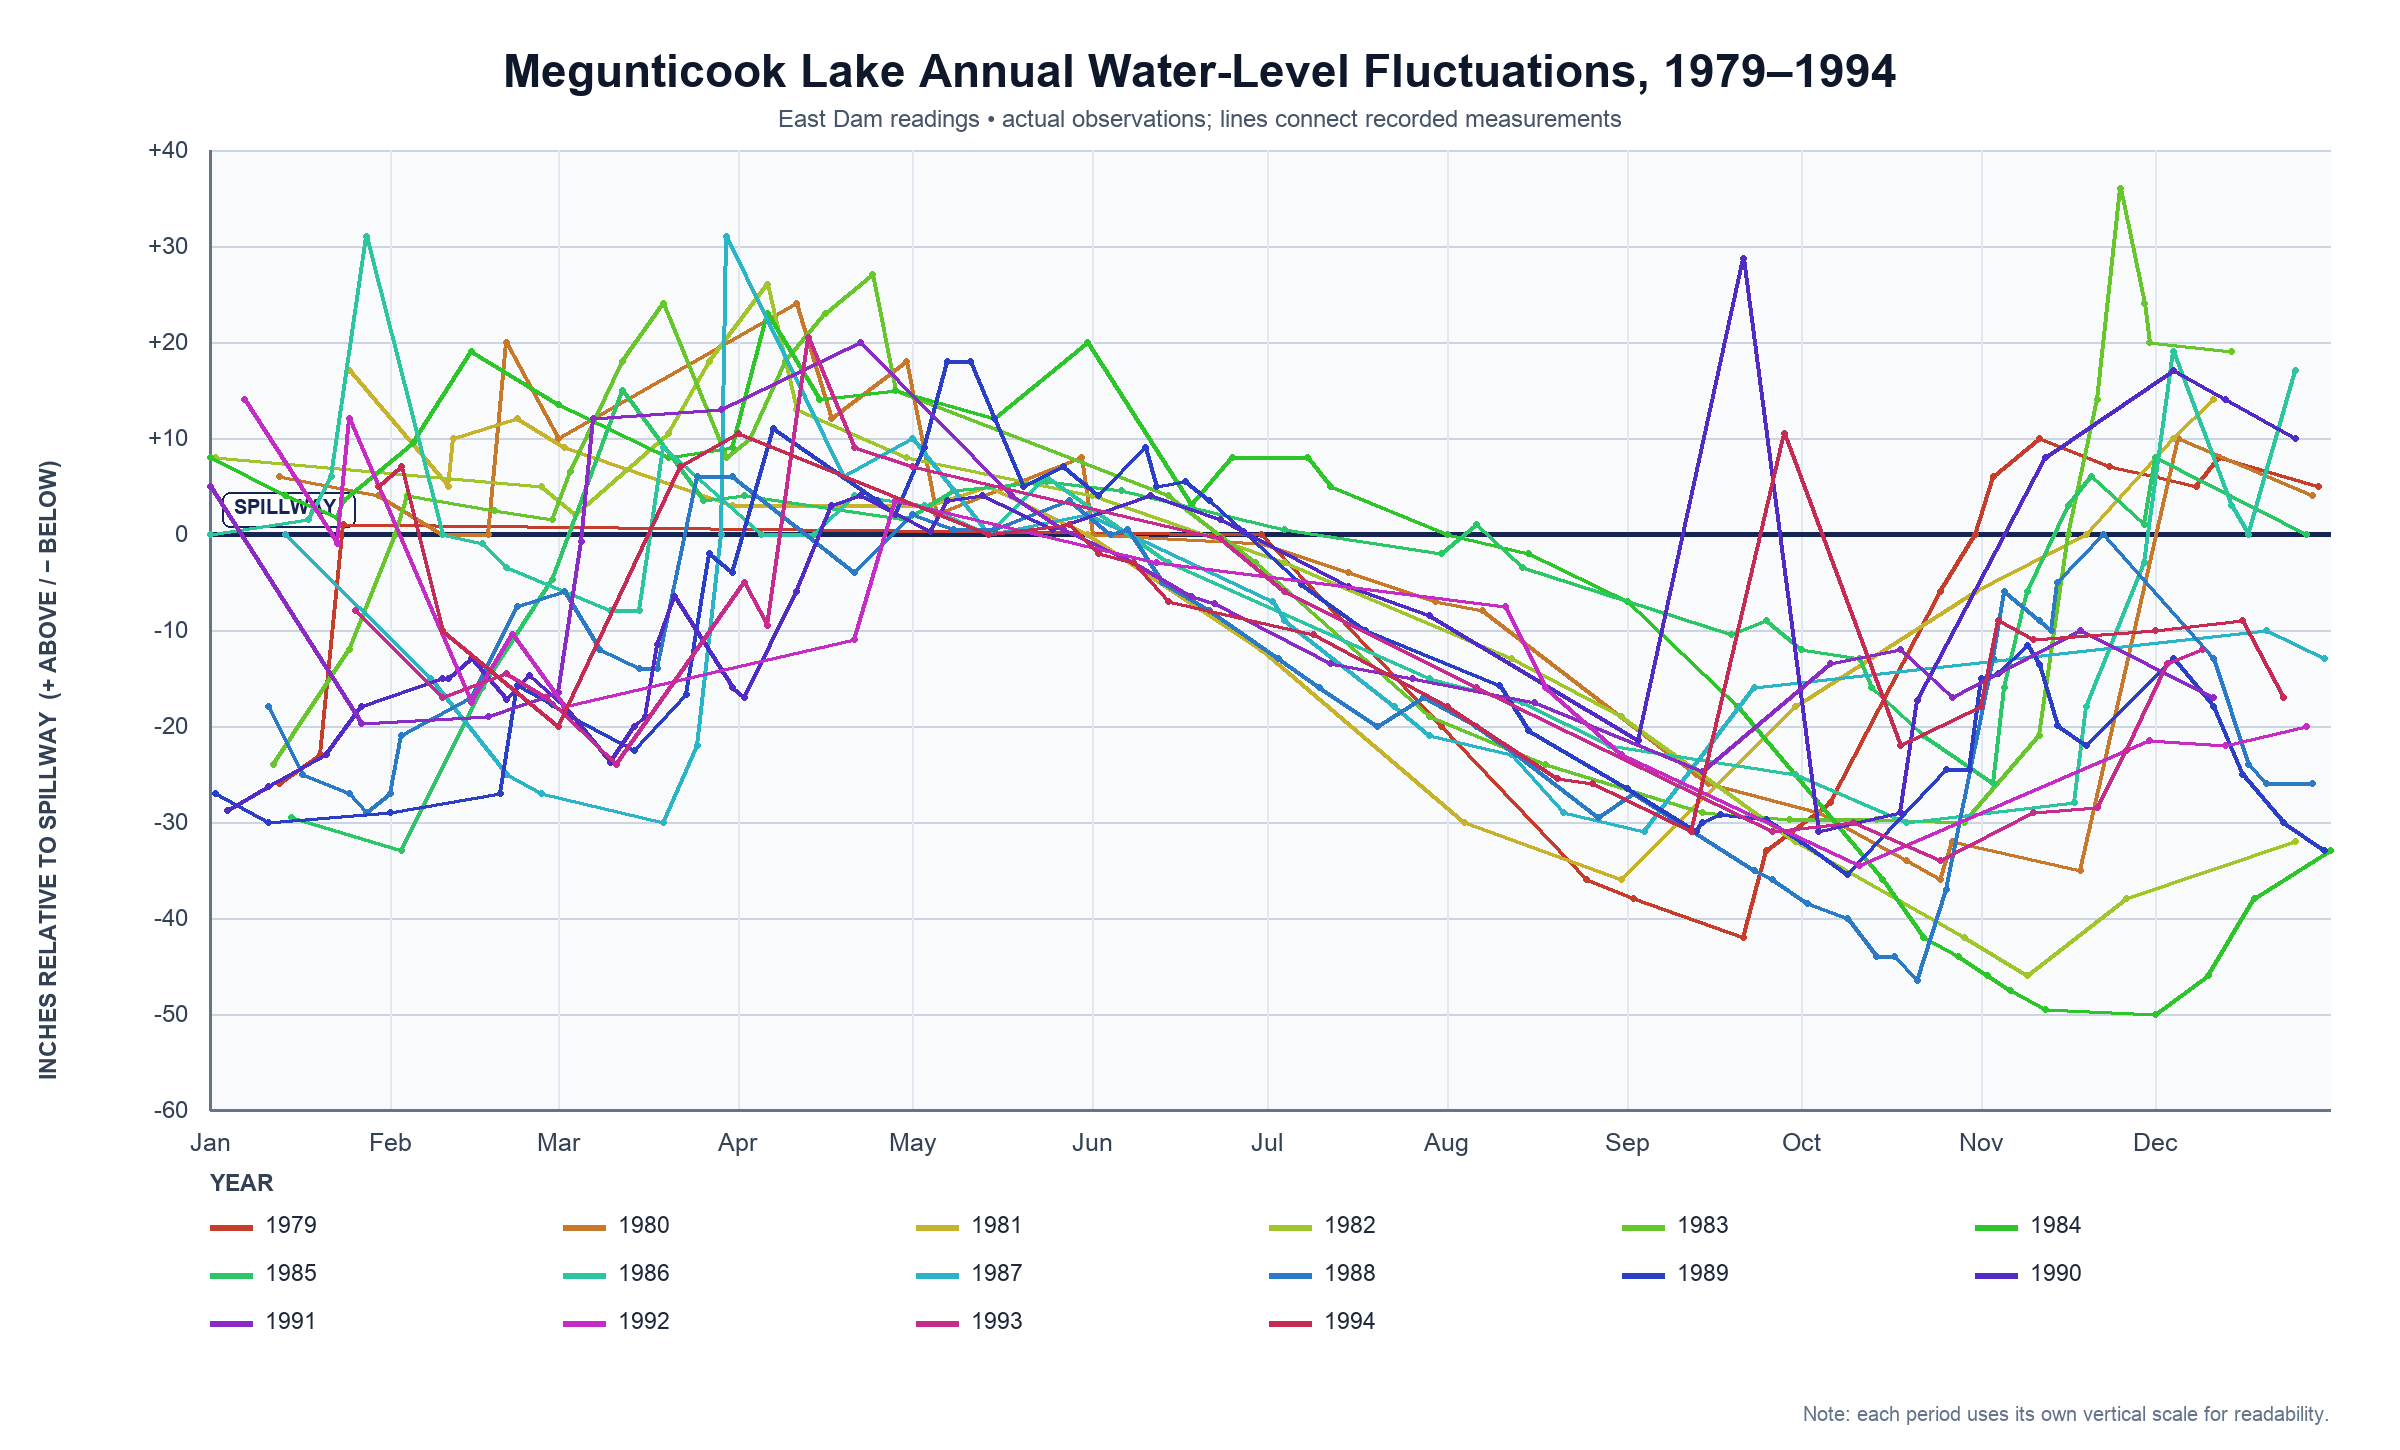
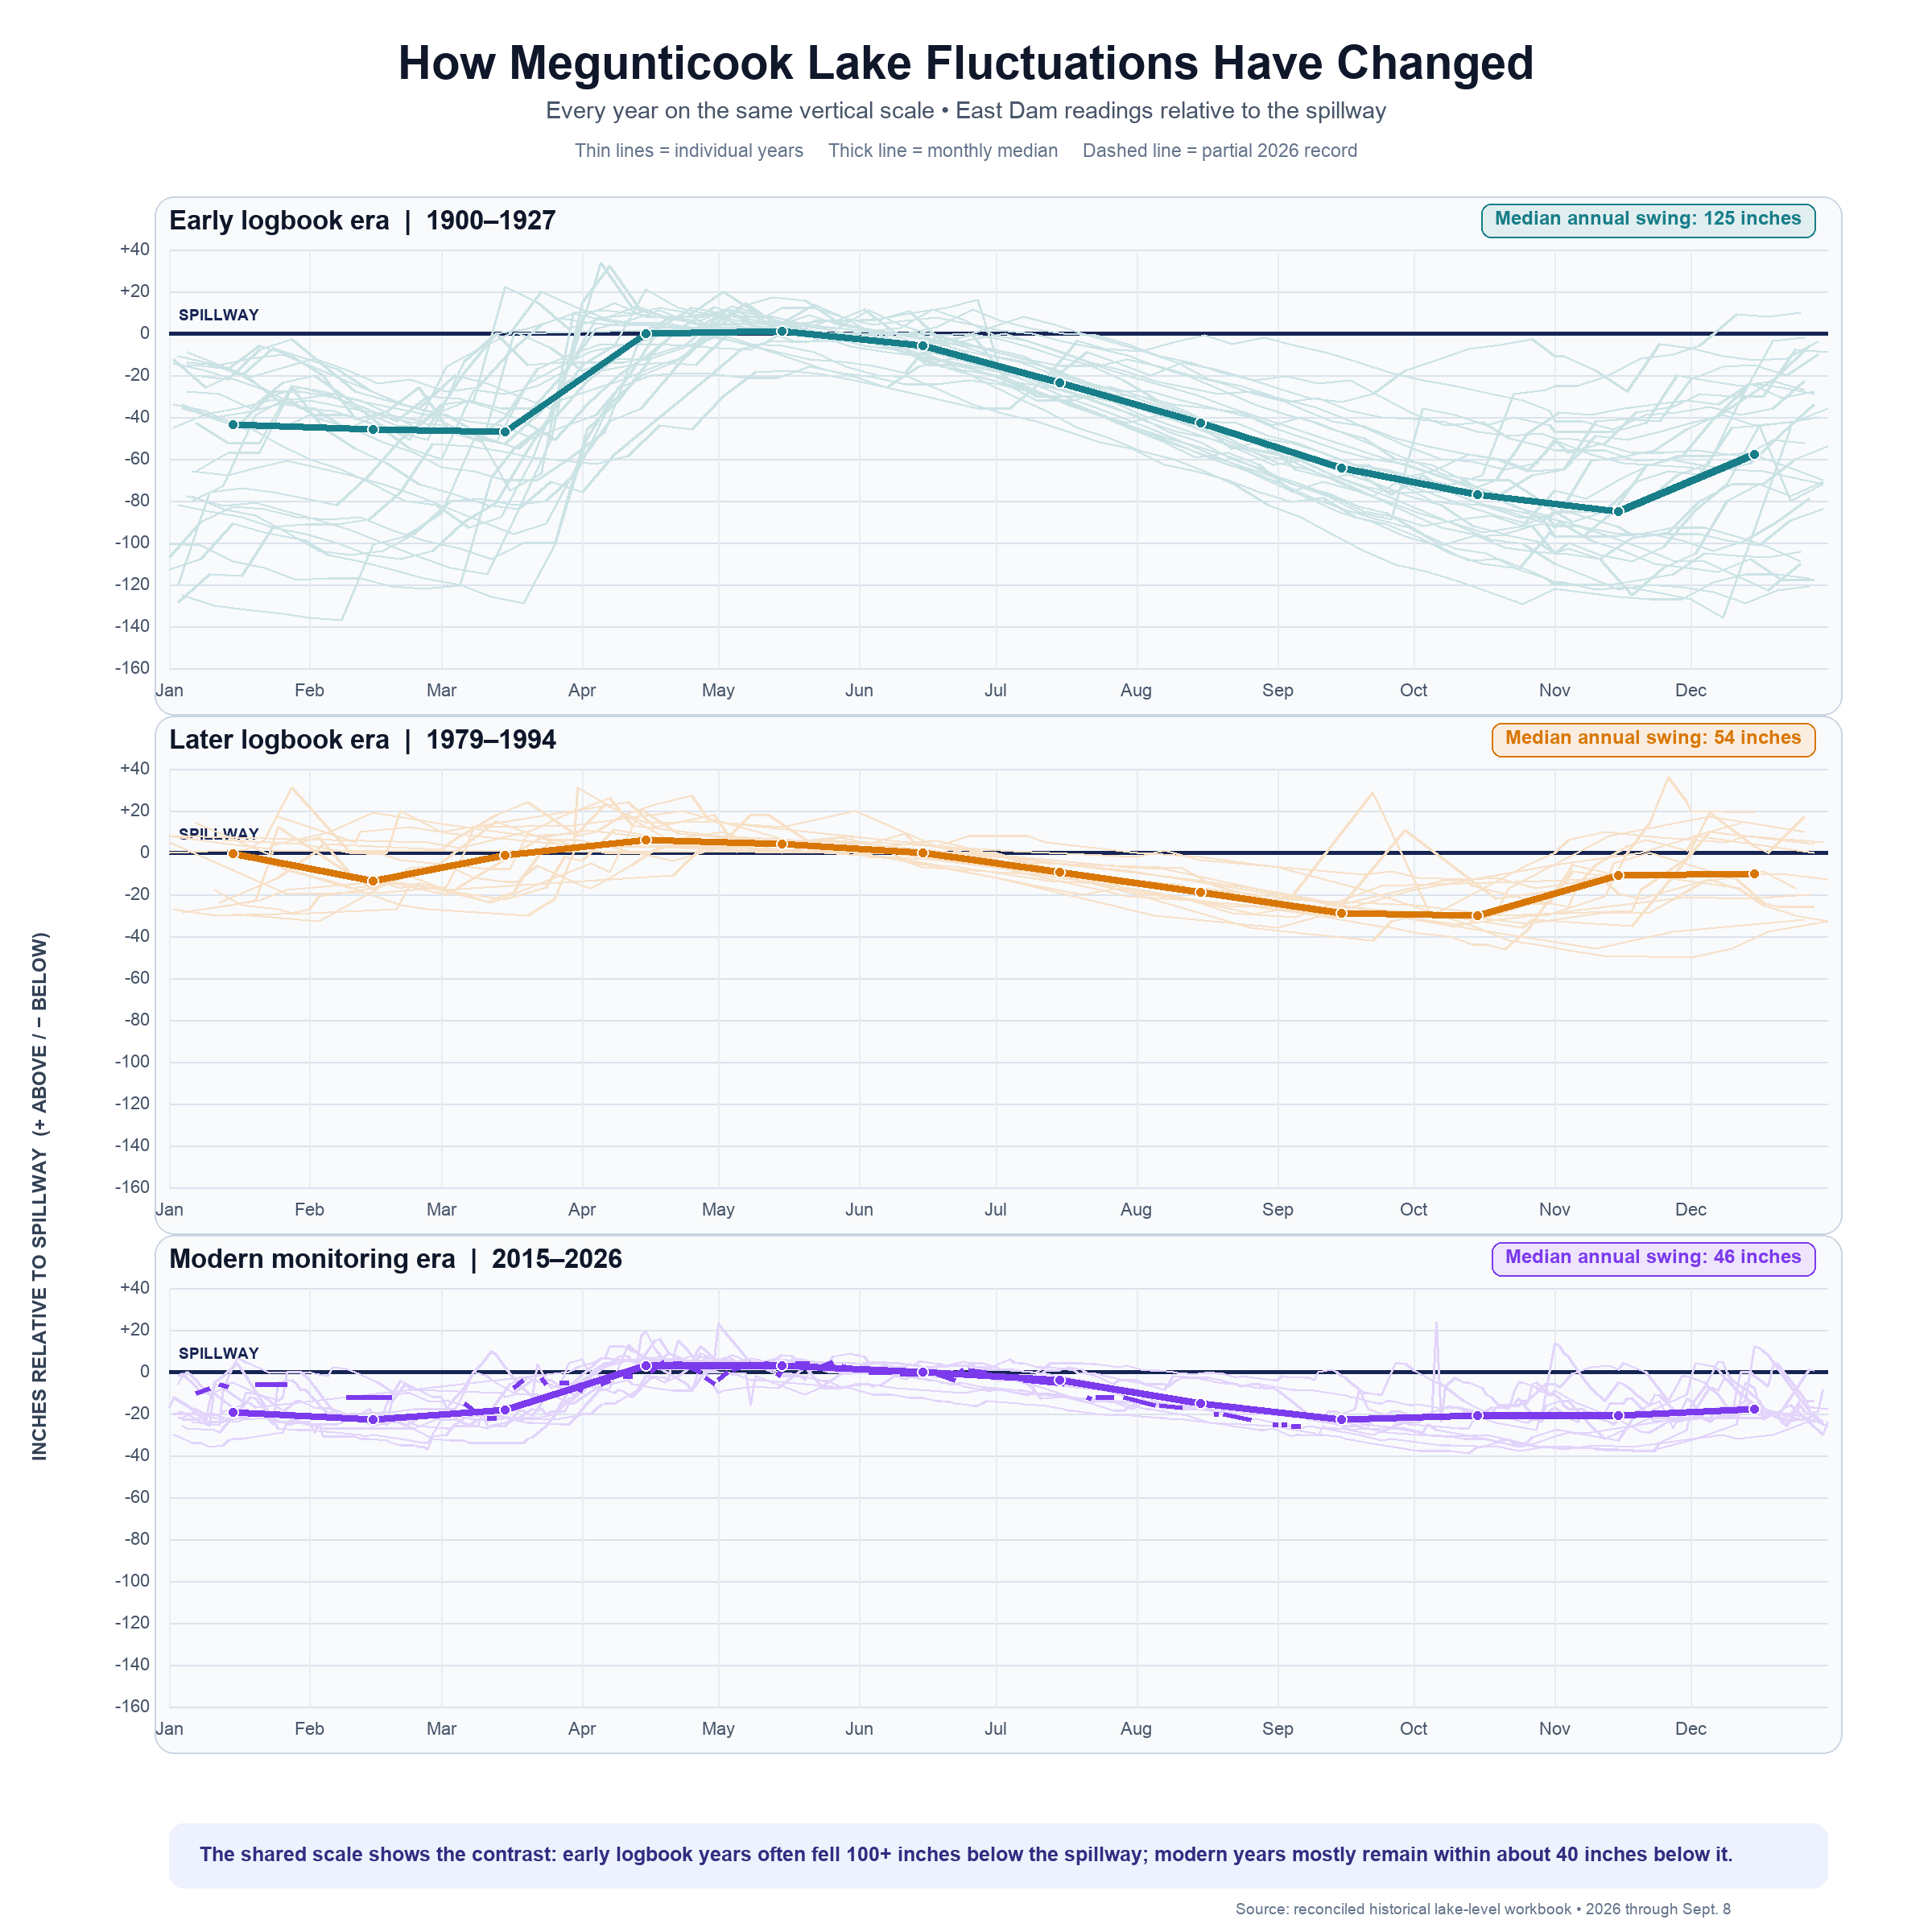
1983 was a year of lots of talking about water levels. The two dams that control the level of the water (right next to each other just upstream from Molyneaux Road) were for sale, and, as usual, some of the people from away were horrified by the cavalier attitude of certain local players regarding such an important resource.
Dr. Ernest Marshall writes: “I find it hard to comprehend that the control of this unique water resource may be sold for commercial exploitation. I am concerned that we have lost sight of the environmental significance of this resource and am therefore writing as a cottage owner and as a scientist… Megunticook Lake has a number of hydrological and geological characteristics that need to be better understood in order to develop a long term water level management plan that meets both riparian and environmental needs.”
Dr. Marshall notes that much of the swing in the level of the lake can be attributed to the water needs of the Knox Mill and their associates. Prior to 1980, changes of 10 feet or more were not uncommon.
Historically, the dams at the lake were owned by the downtown mill owners who used them as a sort of faucet to regulate the flow to their mills. However, according to Marshall—and many before and after him—even without the influence of the downtown mills, the lake responds very quickly to rain and sees “unusually rapid rises” resulting from “steep rock slopes, thinly veneered with glacial soils and marine clays which serve to promote rapid runoff.”
By 1983, the average fluctuation in the lake was around 5 feet , according to Marshall’s article. He noted though that any water management plan for the lake would need to take into consideration how unusually fast the levels can change in response to rain and snow melting events.
“The Knox Mill records kept since 1900 indicate that Megunticook Lake rises 4 inches to 8 inches for every inch of rain that falls on the basin. Other records noted that a heavy three day rain on April 11, 12, and 13, 1940 raised the lake level by 40 inches. One of the most rapid water level rises occurred on July 12, 1915 when slightly over 6 inches of rainfall in 24 hours raised the lake level 33 inches even though the control gates were open.”
Historical water level data has been kept by various entities over the years but has often not been kept organized and all in one place. The January 13, 1983, article by Marshall, referencing the water level records from the Knox Mill has a useful graph, but the microfilm version of the newspaper has cut off the edge with the numbers and I haven’t had a chance to track down the original.
But I was able to find a portion of the documents cited by Marshall. The log book kept by the Knox Mill from 1900-1927 is located at the Camden-Rockport Historical Society. I photographed every page of it and compiled it here for anyone interested.
Knox Mill Log Book (1900–1927) Scans
Joe Sawyer, the owner of the Seabright Mill kept records from 1978 to 1995, and even created annotated graphs which I found years ago in an old box at the town office.
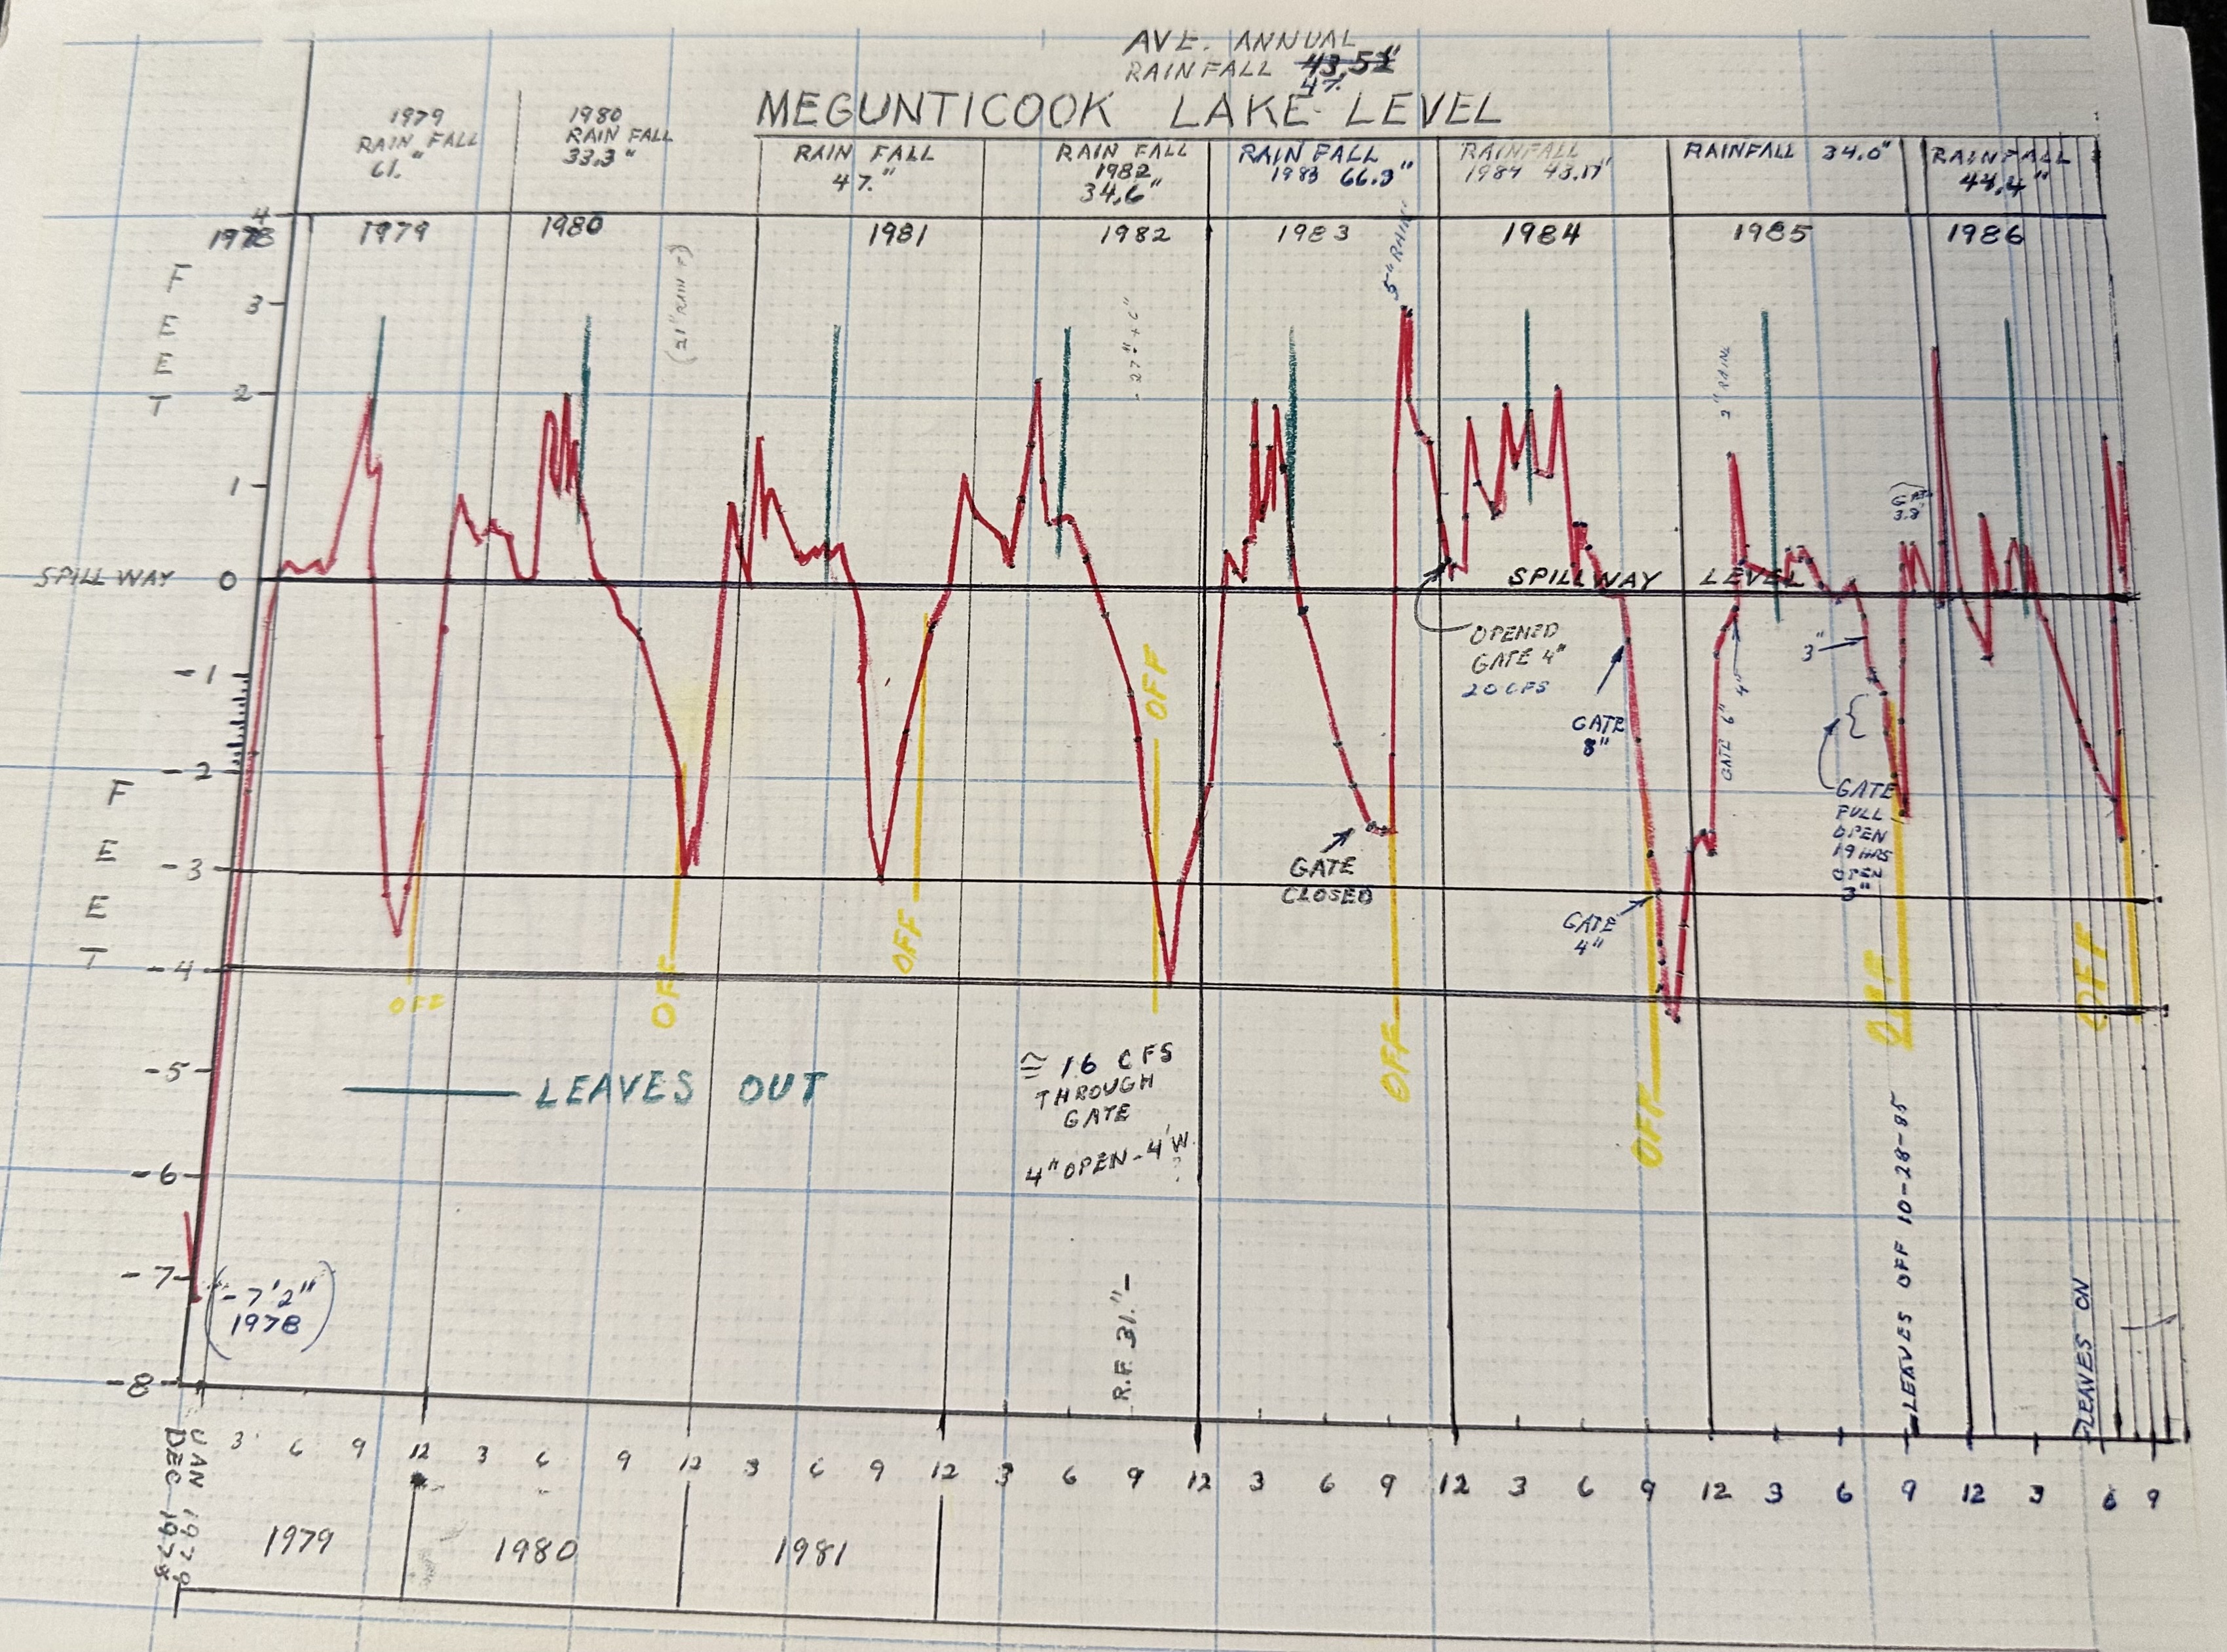
Joe Sawyer's graphs of the lake level. Photo by Alison McKellar
After that, I’m aware of log books kept by the town of Camden from 2014-2022.
In 2023, the Town of Camden began using an online system to post live water level monitoring data which can be found here. I suspect that there is more from the period of 1995-2014 that I haven't found yet and I am also still on the lookout for the rest of the Knox Mill records cited by Ernest Marshall.
I have compiled what I could download from these various sources into a draft spreadsheet for anyone who wants to see the data in an easier to navigate form than the handwritten logbooks. The caveat is that it is still in its draft form and it's possible there are mistakes as much of it involved deciphering and transcribing handwritten notes. Please email me if you have questions, additions, or corrections. Here are some links to the source materials.
Click here to view the Megunticook Lake Level Logbooks 2014-2023.
Updated pages from town logbooks (10/23 to 5/23).
The Megunticook Watershed Association also has information on water levels at the lake. Their real time water level gauges have been intermittently out of commission but their page also contains other information and a link to the town data and current Dam operations policy.
There is a great deal more that could be written about the history of lake levels and the power struggles for the water itself, but it is too much for this one column.
I wrote previously about the lawsuit between the lake property owners in Lincolnville and the Knox Mill Associates, which was taken all the way to Maine’s highest court in the late 1800s.
The outlet of the lake was actually dredged and blasted to allow the lake to be brought down below the natural low water mark during a severe drought. These dams and the outlet of the lake were engineered to allow maximum change in water level at a time when their purpose was quite different. Today, we would never want to lower the lake to such a level, which is one of the reasons why a redesign of the dams may make sense.
These are the lowest recorded East Dam water levels in each year, expressed relative to the spillway. Here is the data compiled from the 1900-1927 weekly log books combined with the data from Charles Wood's November readings between 1900-1947 which were cited by Ken Bailey.
| Year | Lowest recorded | Year | Lowest recorded |
|---|---|---|---|
| 1900 | 109″ below | 1924 | 118″ below |
| 1901 | 136″ below | 1925 | 137″ below |
| 1902 | 66″ below | 1926 | 113″ below |
| 1903 | 104″ below | 1927 | 72.5″ below |
| 1904 | 109″ below | 1928 | 65″ below |
| 1905 | 129″ below | 1929 | 83″ below |
| 1906 | 108″ below | 1930 | 103″ below |
| 1907 | 96″ below | 1931 | 26″ below |
| 1908 | 129.5″ below | 1932 | 25″ below |
| 1909 | 120″ below | 1933 | 51″ below |
| 1910 | 123″ below | 1934 | 13″ below |
| 1911 | 108″ below | 1935 | 89″ below |
| 1912 | 77″ below | 1936 | 76″ below |
| 1913 | 76.5″ below | 1937 | 56″ below |
| 1914 | 129″ below | 1938 | 22″ below |
| 1915 | 128.5″ below | 1939 | 92″ below |
| 1916 | 97.5″ below | 1940 | 43″ below |
| 1917 | 70″ below | 1941 | 69″ below |
| 1918 | 106″ below | 1942 | 62″ below |
| 1919 | 91″ below | 1943 | 4″ above |
| 1920 | 93″ below | 1944 | 72″ below |
| 1921 | 120″ below | 1945 | 39″ below |
| 1922 | 122″ below | 1946 | 83″ below |
| 1923 | 125″ below | 1947 | 72″ below |
Important caveat: 1900–1927 generally has weekly observations, so these are credible annual minimums. From 1928–1947, most years contain only a November 1 reading. Those later figures are therefore the lowest recorded level—not necessarily the year’s true lowest level.
Looking at over 100 years of water level data, it’s clear that the lake has almost always been kept much lower than it is today, but not always on purpose, and often to the detriment of wildlife.
The low levels often meant that we had a significant buffer when major rain events happened. Today, the lake level policy is to keep the water level fluctuating no more than 30 inches per year with a target of 20-24 inches below the spillway after Labor Day to protect from fall hurricanes and to slowly let the lake rise after the threat of spring snowmelt and intense rains have passed. Ideally, the level should never be higher than 6 inches above the spillway.
With extreme rain events happening with greater and greater frequency, the very small openings at the outlet dams and the massive amount of water that rolls through the watershed, it seems clear that maintaining a stable lake level will be more difficult than ever before. For reference, in October of 2020, the lake was about 3 feet below the spillway due to repairs being made on the West Dam. I took a few photos showing the shoreline of the lake looking low, revealing tree stumps along what may have been closer to the original boundary of the lake. Now imagine going seven feet lower than this (not in distance but in actual water elevation) and you can begin to get a sense of how low it used to go!

Watershed map showing location of the dams. Town of Camden
There is a lot more that could be said about water levels but here are a few questions of the pieces of the puzzle that I have gleaned over the years as well as some links to more information.
Which dams control the level of Megunticook Lake and Norton Pond?
The two dams at the outlet of Megunticook Lake are called the East and the West Megunticook Lake outlet dams. The lake level reading is taken at the East Dam in the same location data has been recorded for over 100 years. Only these two dams have any impact on the water level of Megunticook Lake and Norton Pond.
Which dam controls the water level at Shirt Tail Point Park, Hodson Park, and the section of the river between Mount Battie Street and Molyneaux Road?
The Seabright Dam has been owned by the Town of Camden since 2007 when it was acquired from Joe Sawyer who operated a small hydropower project for many years. The Town continued the hydropower project for almost a decade but ultimately voted to decomission due to the high cost of maintaining equipment and complying with FERC rules.
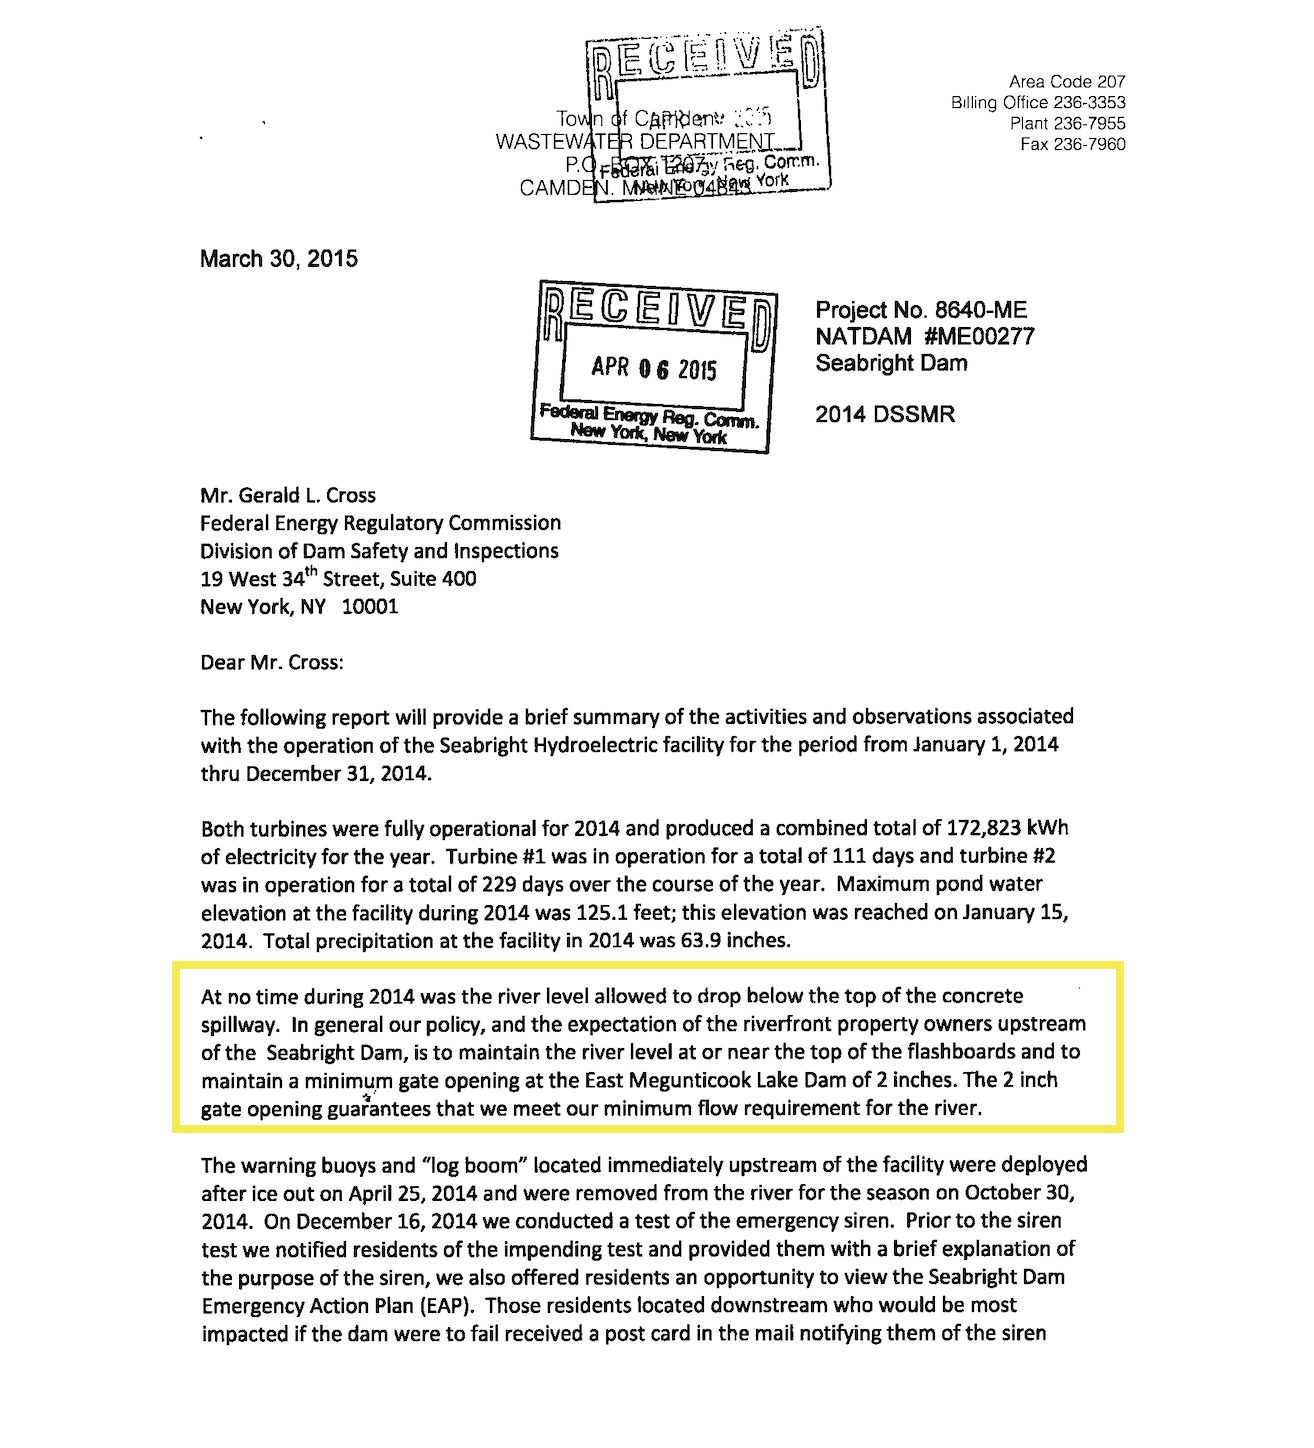
After earlier dam owners lowered the water level behind that dam without notice to property owners, residents along the river formed a group that successfully lobbied the state to impose a water level order. Later, Joe Sawyer's FERC license required that he maintain roughly 12 CFS of flow downstream or an amount equivalent to the inflow. When the Town operated that hydropower project, annual filings on minimum flow explicitly stated:
"At no time during 2014 was the river level allowed to drop below the top of the concrete spillway. In general our policy, and the expectation of the riverfront property owners upstream of the Seabright Dam, is to maintain the river level at or near the top of the flashboards and to maintain a minimum gate opening at the East Megunticook Lake Dam of 2 inches. The 2 inch gate opening guarantees that we meet our minimum flow requirement for the river."
In 2017, when the town officially surrendered the FERC license, it agreed to continue operating under the same guidelines. Now that the dam is no longer sending water through a turbine, the water is allowed to overflow over the dam's large spillway, without any mechanical adjustments being made. This has worked well since major repairs were made to the dam in response to leaking and low water levels.
Here is an article from 2016 on low water on the river and lake.
Why doesn't the town close the gates at the outlet of the lake completely to keep more water from escaping?
The town has long followed minimum flow policies developed by all parties along the river, approved by the Select Board, and incorporated into federal filings for regulated portions of the river. Completely shutting off the flow from the lake has negative consequences for downstream ecosystems and property owners. B
efore the Town took over ownership of the dams, the lake level was allowed to fluctuate more and the gate was left at four inches as a matter of practice and not law. The regulatory minimum flow was initially established as part of requirements for hydropower operation at the Seabright Dam and was set at 3 inches and then reduced to multiple times. The Town policy now reads 1.5 inches of gate opening. I have been told that the reductions were made due to the fact that it was known the dams also leak.
Earlier versions of the dam operations guidelines cited requirements to notify downstream property owners if the gates at the lake were closed to less than three inches and they prohibited restricting the flow to less than two inches.
At some point, the Town of Camden updated the official policy to allow for a 1.5 inch gate opening at the East Dam, but reports to FERC continued to specify two inches.
Of course this has never been a perfectly exact science because all dams leak a certain amount, but if the town were to restrict the flow from the lake excessively, or stop it completely, it would could very easily lead to a violation of water level committments behind the Seabright Dam as well as completely dry up the portion of the river downstream of the Seabright Dam.
Another concern would be that reduced flow from the lake would mean that less water is flowing through the section of the river popular for swimming and paddling. This section of the river is far shallower than the lake and more susceptible to algae growth and increased water temperatures.
What else impacts lake level?
Groundwater levels, evaporation, input from tributary streams, and overall geology of the area impact lake level significantly. Also, in areas with deep frontage and steep bedrock, a difference of a foot or two of elevation doesn't make a dramatic difference, but in areas of the lake that it is already shallow, even a foot of change in water levels can reveal tens of feet of additional dry land or mud flats.
Joe Sawyer's records indicated that 8-12 inches are lost on Megunticoook Lake and Norton Pond to evaporation alone during the summer months. Larger lakes lose more water to evaporation. It's important to remember also that none of the dams downstream from the East and West Dams have any ability to influence lake level.
Removing dams downtown cannot impact lake level. Rain is by far the biggest factor and the lake level can rise much faster than it falls.
For more information on the dams and what each of them do
Town of Camden Megunticook Watershed resource page: The water level on Megunticook Lake is not impacted in any way by the Montgomery Dam at the head of the harbor. You will find a lot of information on this page related to Montgomery Dam because that is what the town just voted on, but there are other links to studies and maps that will be useful. Only the East and West Megunticook Lake dams control the level at the lake and the flow from them. There is absolutely no contemplation of removing the East, West, or Seabright Dams! Those dams are high hazard, high value for recreation dams.
The Megunticook River Citizens Advisory Committee created an interactive map of the watershed and the dams.
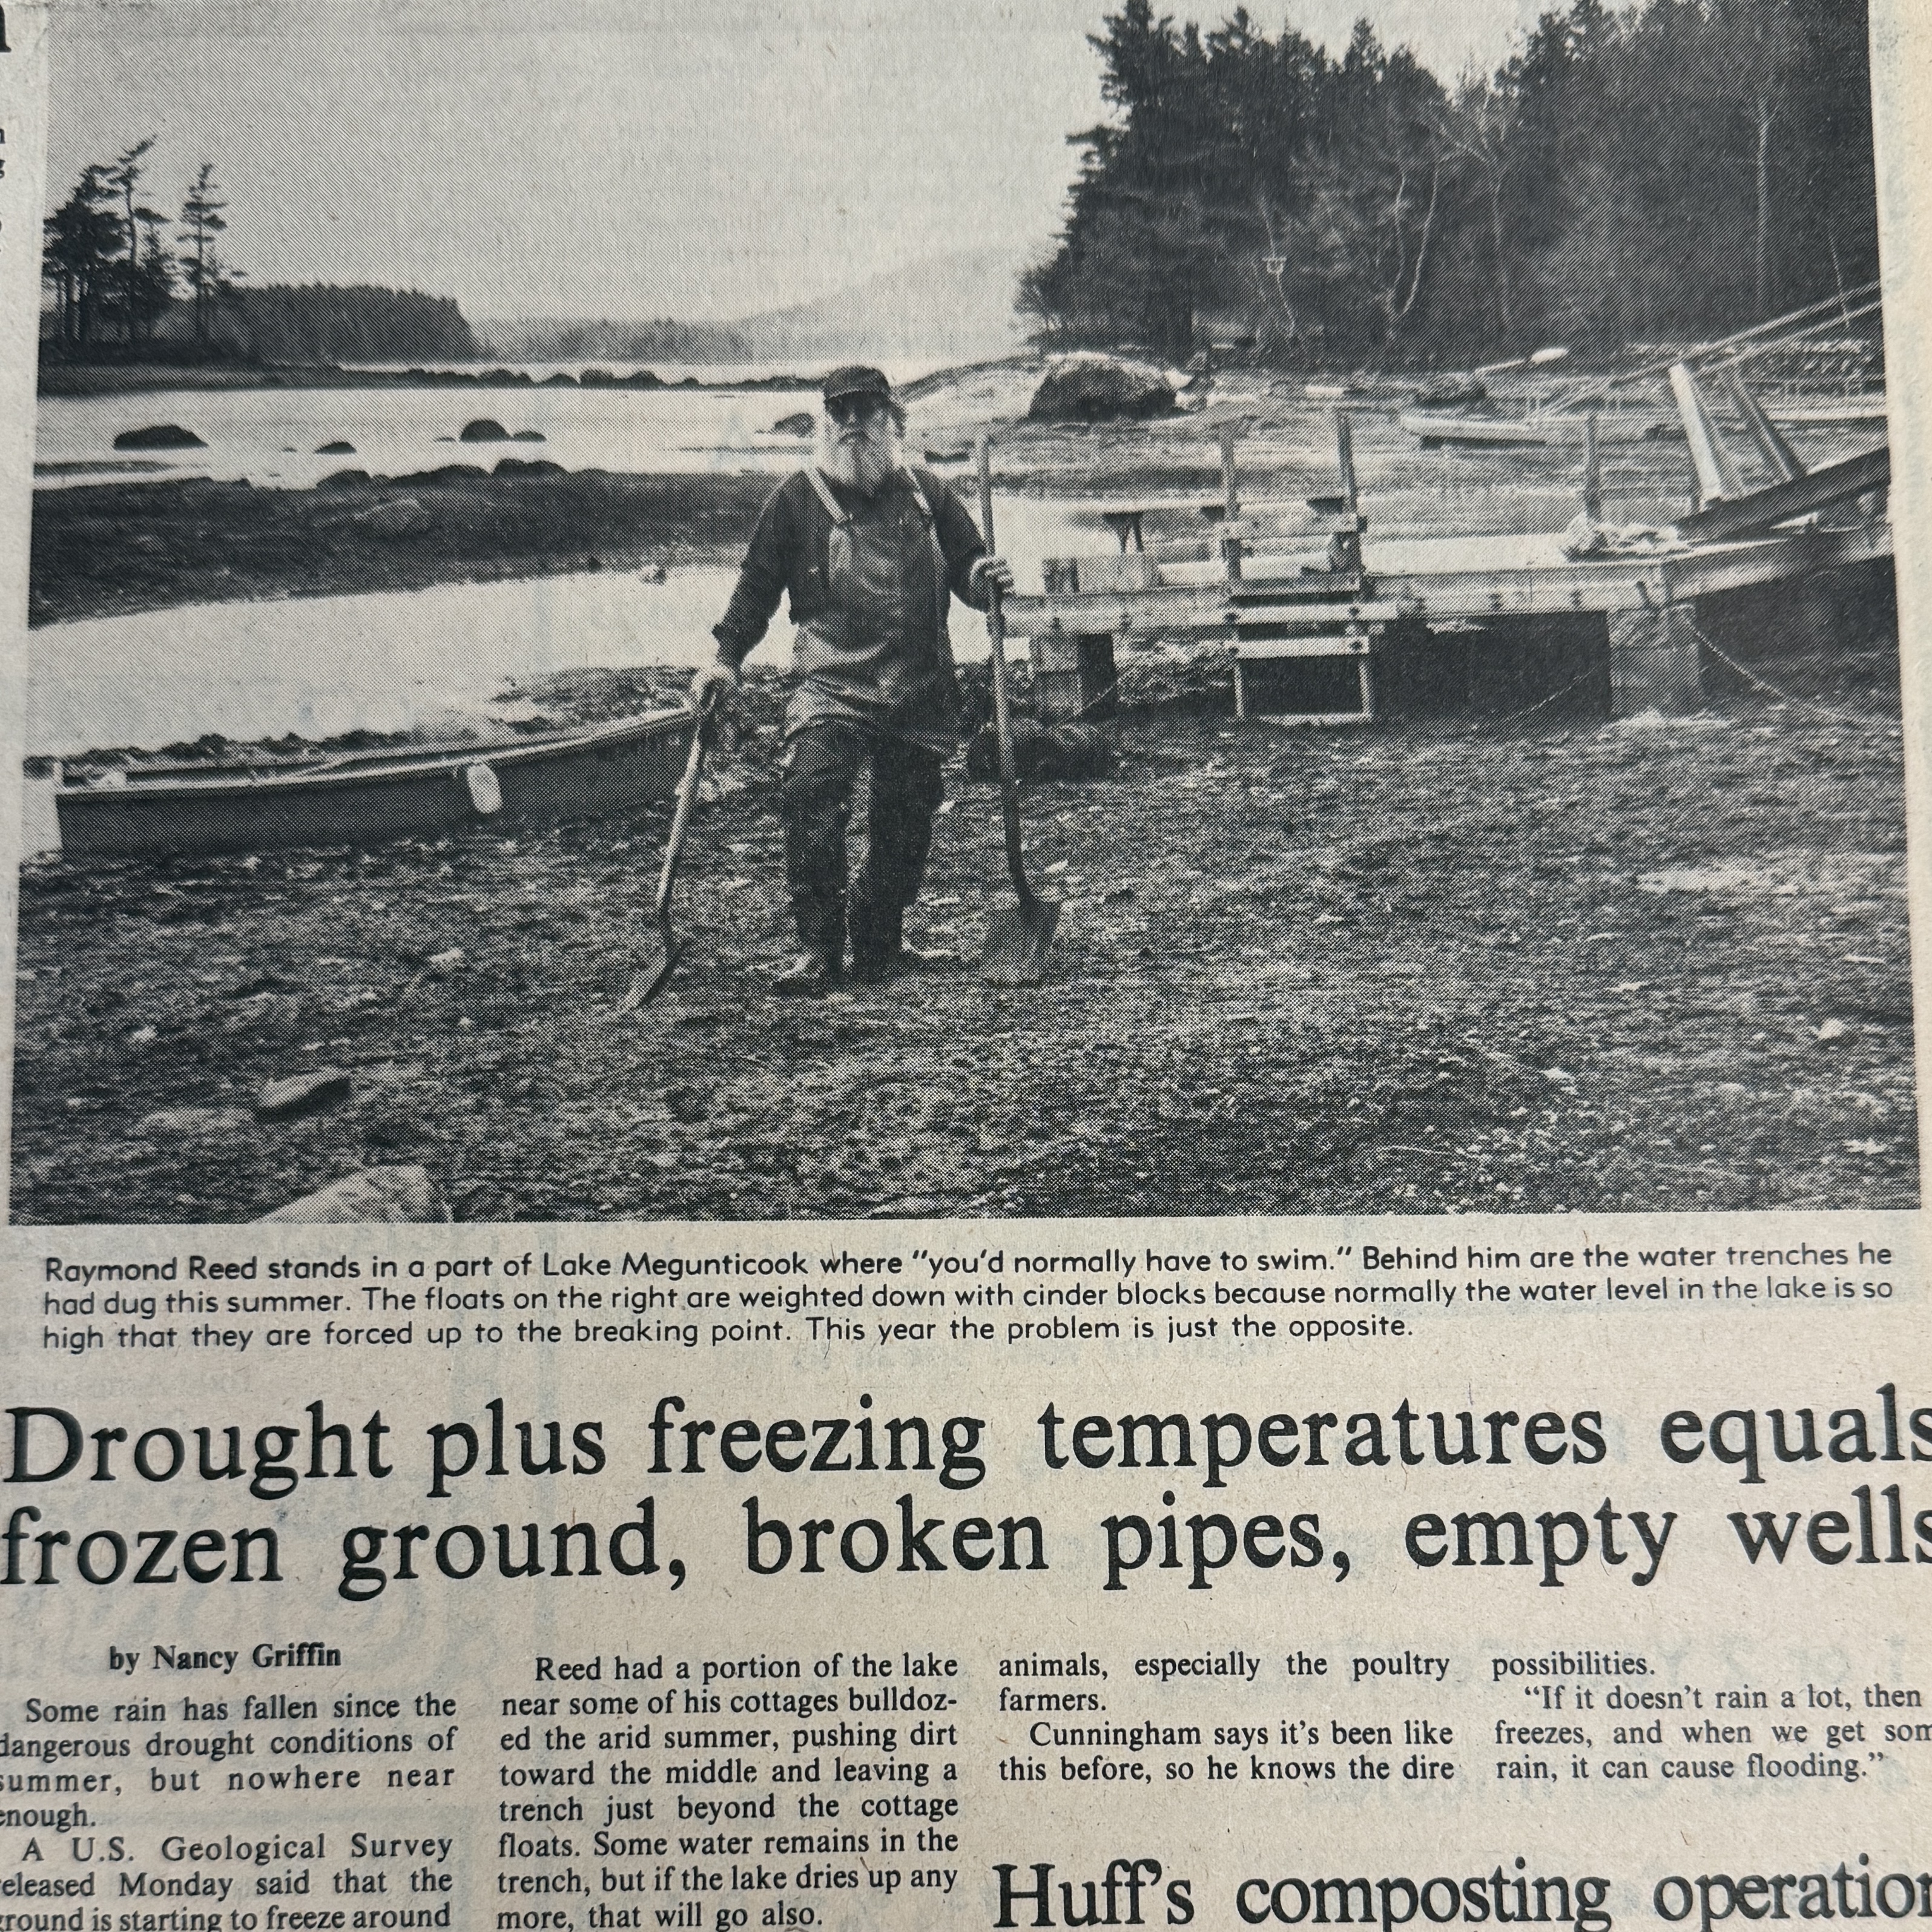
A November 16, 1978 article in the Camden Herald when the lake was roughly 80 inches below the spillway. This was before the Town of Camden took ownership of the dams. Photo by Alison McKellar. Newpaper archive located at Camden-Rockport Historical Society.
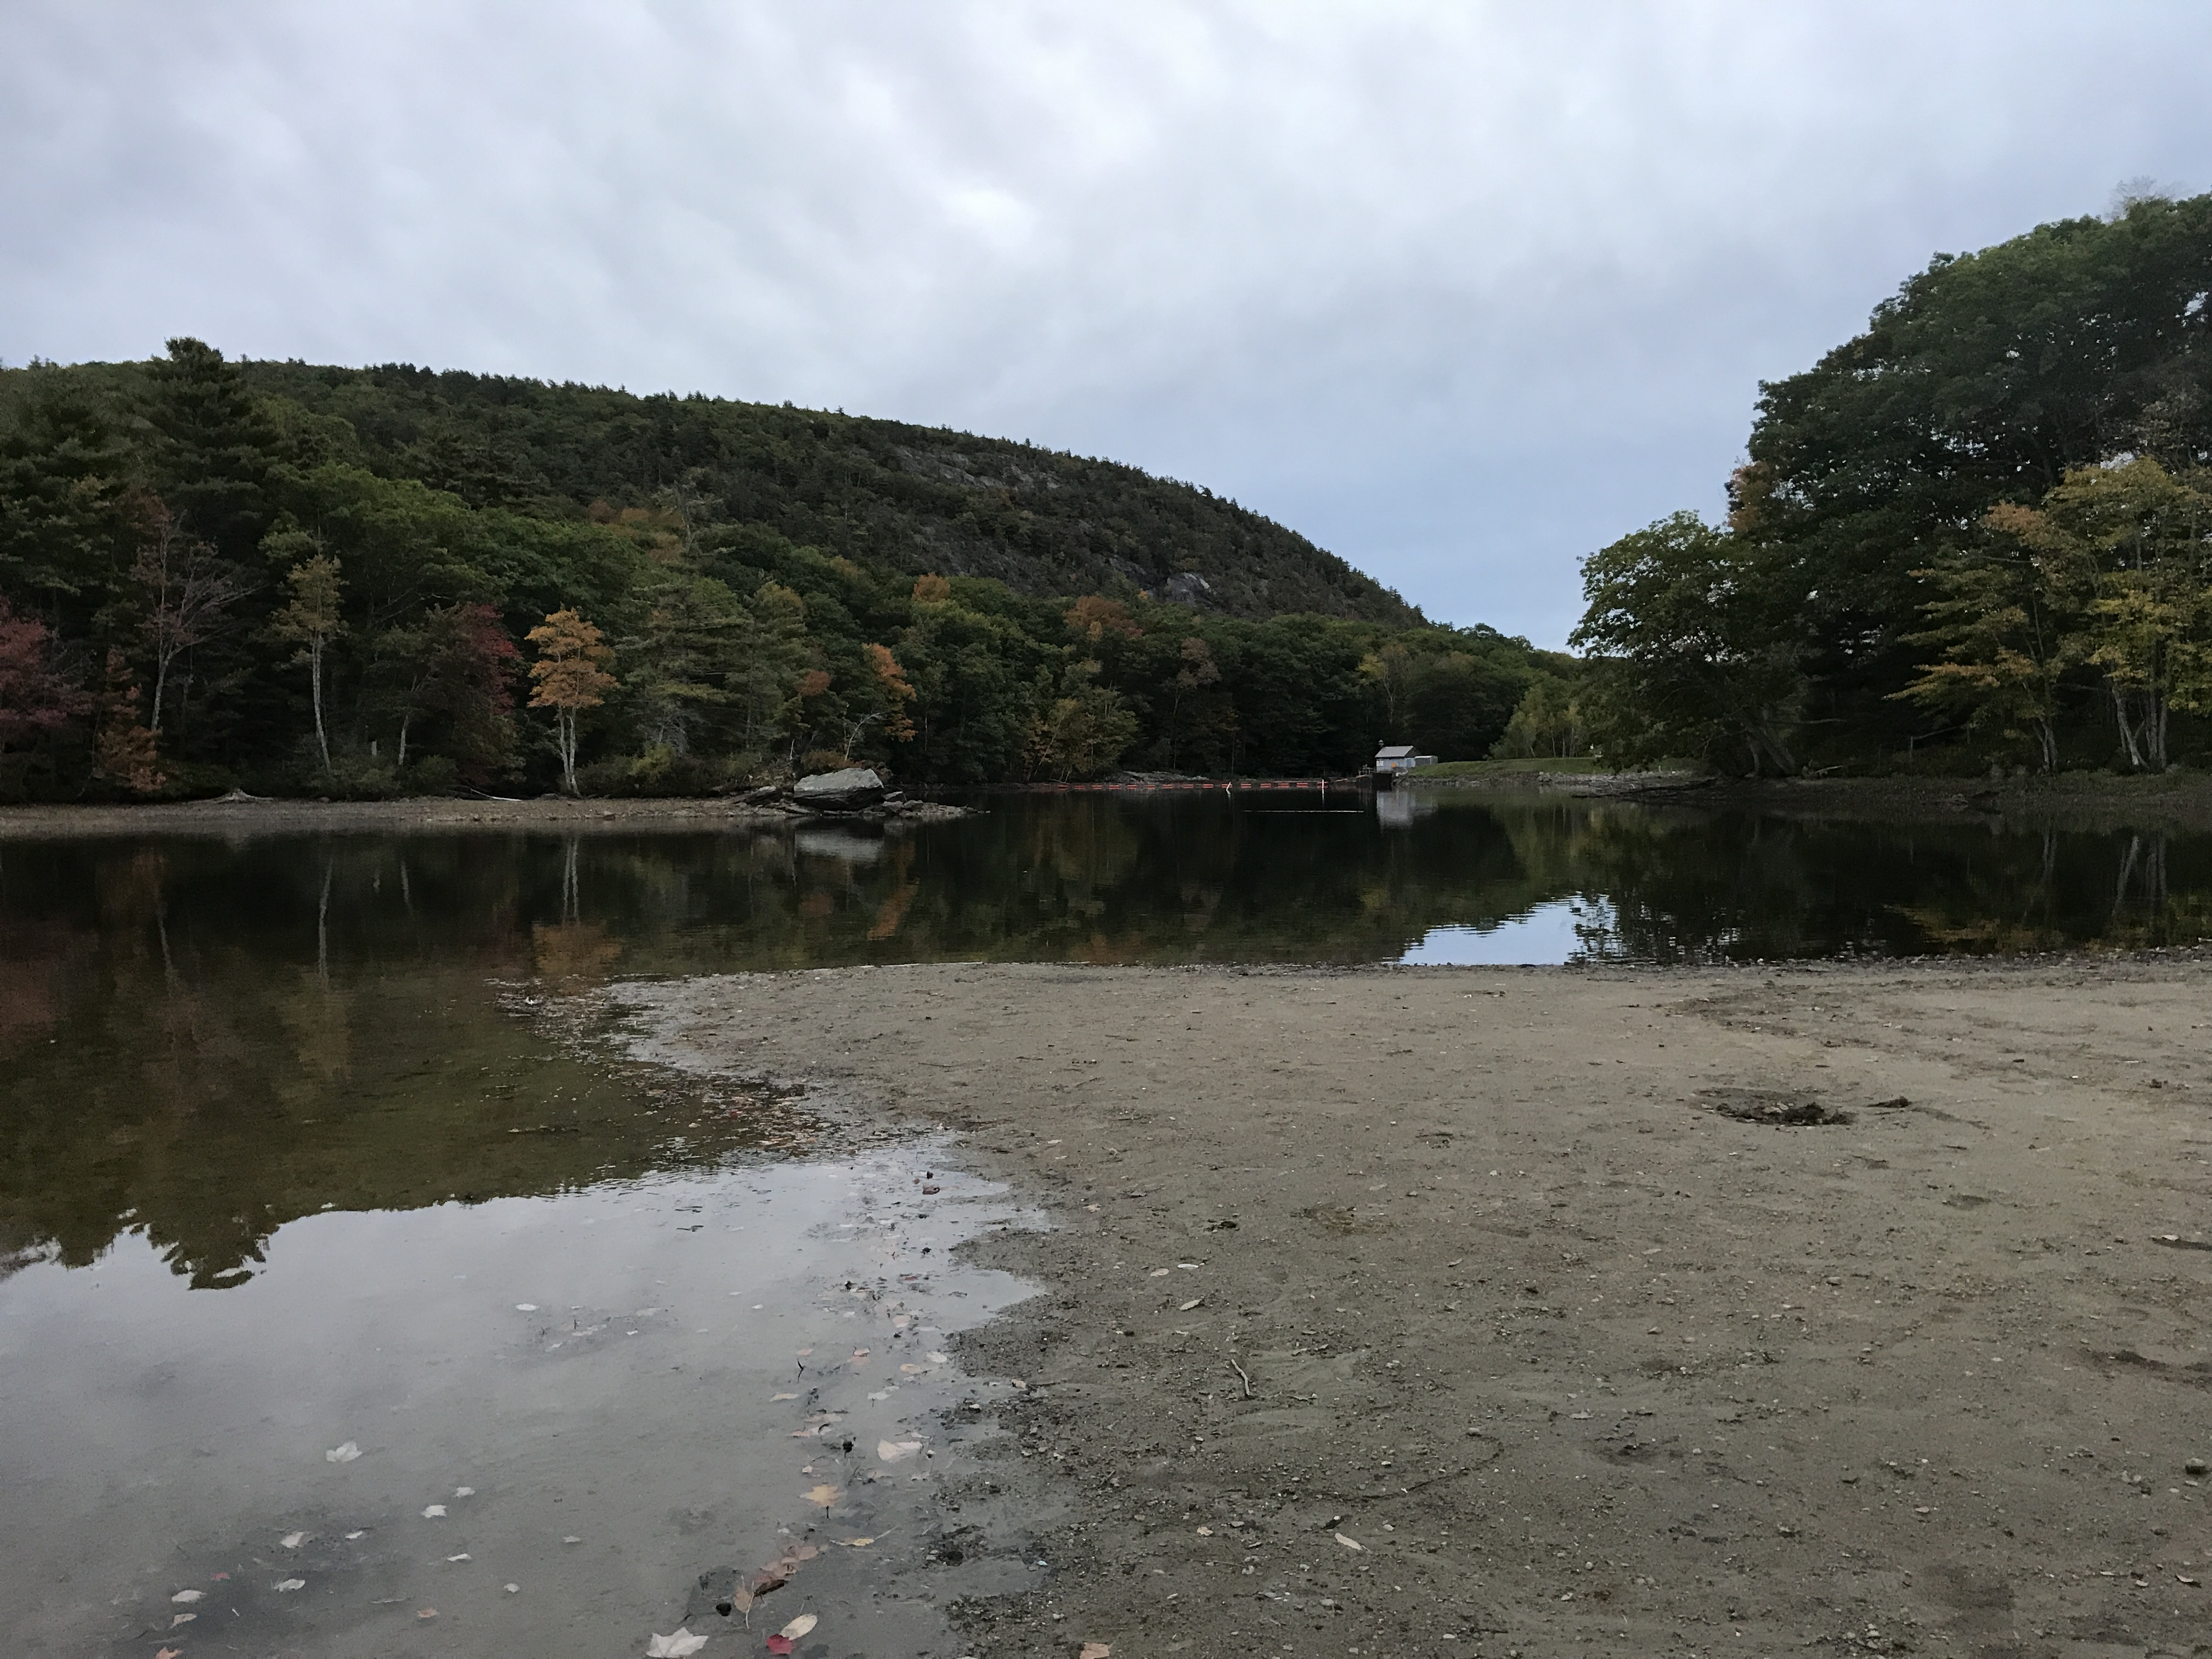
Low water level behind the Seabright Dam at Shirt Tail Point Park in 2017 before repairs to the dam were made. Photo by Alison McKellar

The Megunticook River downstream of the Seabright Dam when flow was accidentally completely stopped during a repair in 2017. Slow drops in water flow are very common under natural conditions, giving mussels and fish time to move and adjust. Rapid changes from medium to very low flow do not occur in nature and are harder for aquatic life to adjust to. Photo by Alison McKellar

Although low water might be the concern now, Megunticook lake and river are well known for water rising very quickly during extreme rain events. Here's a photo from November 1, 2021 showing flooding at Bog Bridge. Photo by Alison McKellar
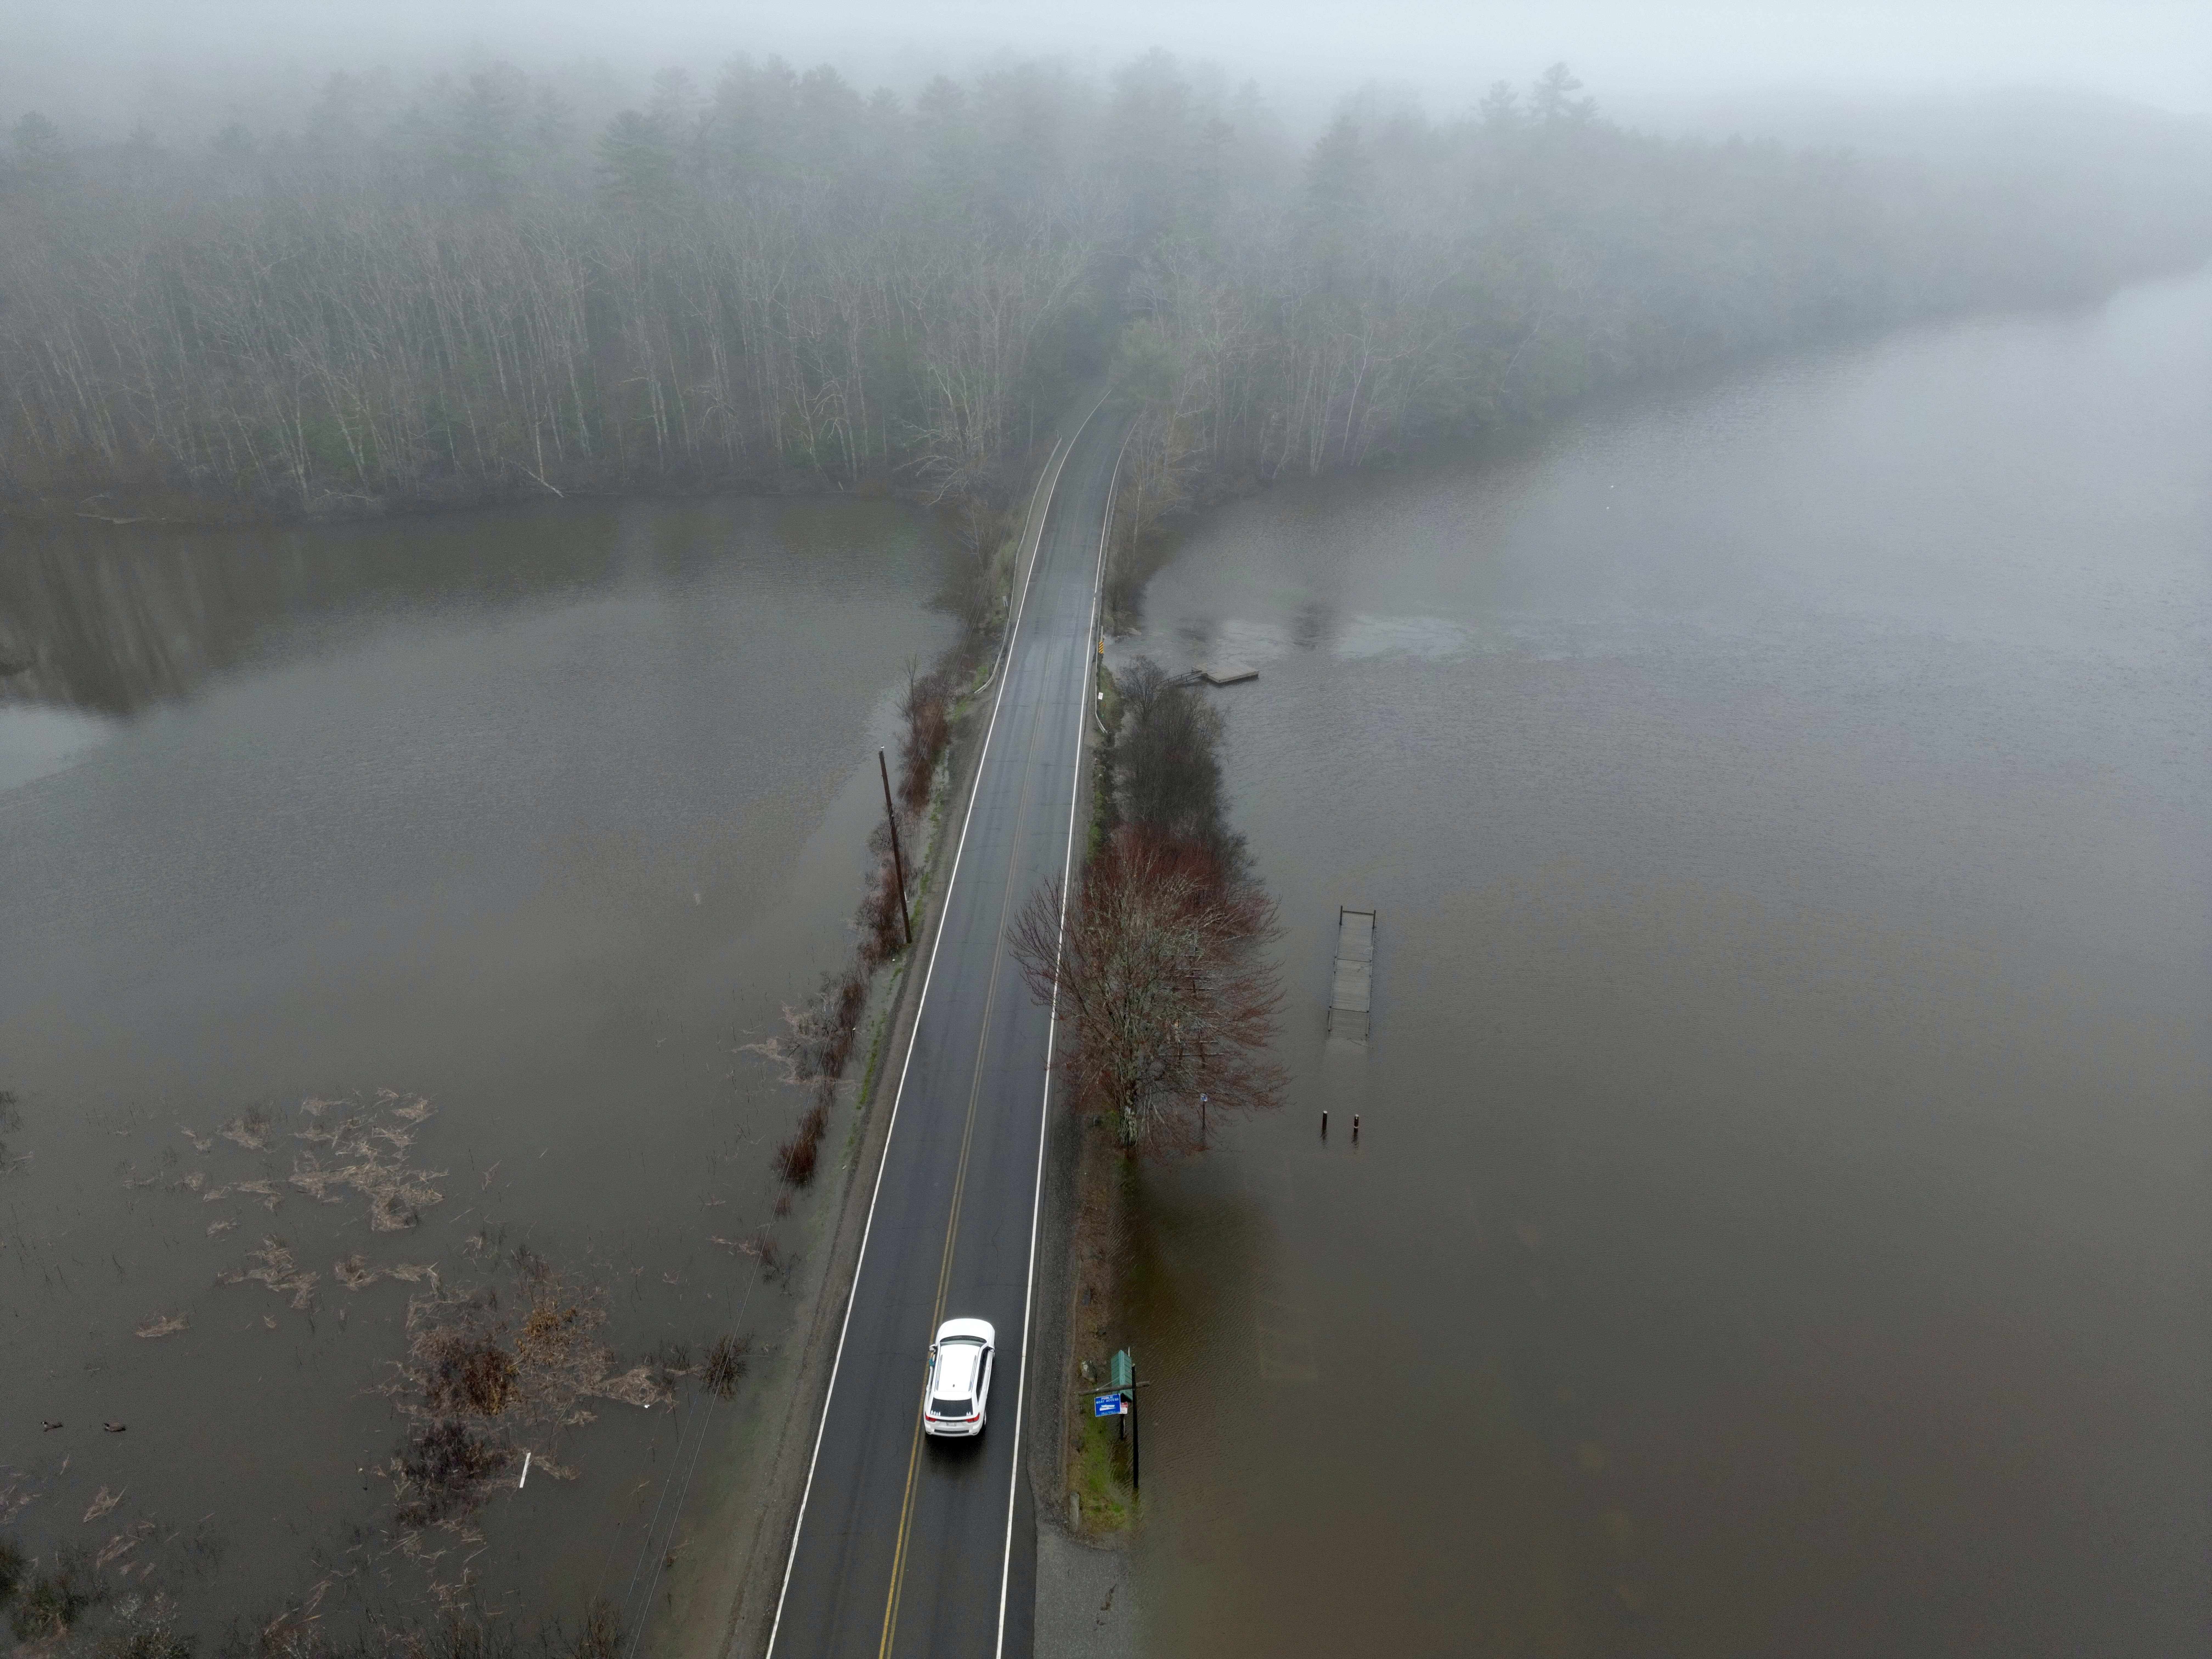
Photo by Alison McKellar