Perspective: When one of my neighbors. Tom, sees me at the Bagel Cafe in the morning, he always asks what I expect the stock market to do. As a reader of my Comments, he should know that my focus is to look into what happened in the market as it was related to economic events in the past week, not to predict the future. The intention is to explain, not to forecast. I use valuation metrics and analyst earnings forecast to make judgements on the richness or cheapness of the market relative to future earnings. A cheap or rich market can get cheaper or richer, or it can become less rich or less cheap. The point is that we can look at the data and determine that we are paying a rich or cheap price, but that does not necessarily predict the future.
In full disclosure, besides not having a verifiable track record of predicting the future, I don't have a sense of smell. I don't remember ever having this sense. This shortcoming was an important factor when, on Saturday morning I woke up and looked out the window to see a skunk dying in the driveway. It did not appear to have been hit by a car or attacked by an animal, but it was obviously on its last breath. Neither the Camden police, animal control, nor Maine Wardens would get involved. Maine Wardens offered their advice, they suggested that I allow the skunk to pass, to dig a hole, and bury the animal. I followed their advice and placed a stone on top of the skunk's grave. Not being able to perceive odor does not mean I don't have an odor, but it allows me to address this crisis or give the dogs a bath when they get sprayed. If you happen to see me at the Bagel Cafe, be kind with your comments about my odor, and, don't go turning over rocks in my side yard.
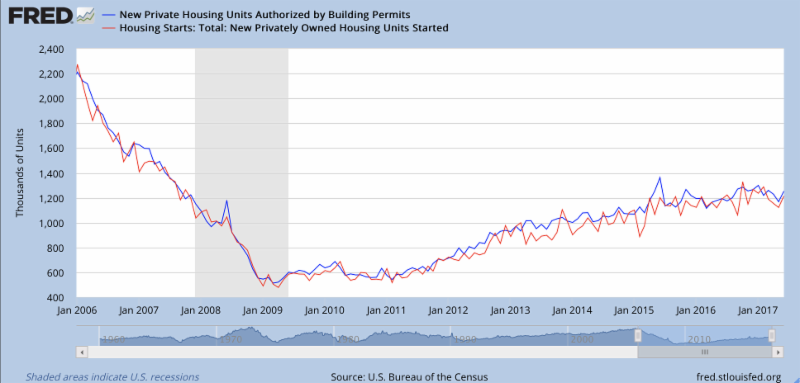
Economic Releases: US Housing The June Housing Starts rose 8.3% to 1.215 million; Housing Permits (SAAR and blue in the chart below) rose 7.4% to 1.254 million. Both were just above the range of expectations. The chart shows that the level has had a long increase from the 2008 recession, but still remain about half of what they were in the pre-great-recession peak in 2006. In spite of the rise of the Starts data, the optimism did not extend into the National Association of Home Builders' Housing Market Index, which dropped 2 points to 64 in July, below the range of expectations. Source: St Louis Federal Reserve, FRED, Econoday via WSJ.com |
Other US Releases: Initial Claims for Unemployment Benefits dropped 15,000 to 233,000 the week of July 15th; the 4-week average of Claims also dropped to 243,750. Continuing Claims, reported on a 1-week delay rose 28,000 to 1.977 million. The Unemployment Rate for insured workers remained very low at 1.4%. The Jobless Claims data lay a positive foundation for a solid July Employment Report. On the softer side, two city Surveys, the Philadelphia Fed Business Outlook and the Empire State Manufacturing Survey both dropped in July. Source: Econoday and the Wall Street Journal |
Economic Releases outside the US The European Central Bank met and, as expected, made no changes in interest rates or asset purchases; the benchmark refi rate remained at zero; monthly asset purchases remained at 60 billion Euros. ECB President Draghi's comments were upbeat on the economy and cautious about inflationary pressures. In Germany, the ZEW Survey slipped for Current Conditions and Business Expectations in July. In the UK, Retail Sales rose +0.6% in June, up 2.9% from a year ago. The Bank of Japan also left monetary policy unchanged when it met this week; the target interest rate remained at zero; asset purchases were set at an annual rate of 80 trillion Yen. BOJ officials also pushed back the expected timing for inflation to rise to its target level. In China, Home Price increased 10.2% from a year ago. Source: Econoday and the Wall Street Journal |
Equity and Bond Index Returns: Equity markets were mixed over the past week even though some of the US indices flirted with record highs. The earnings reporting season has started with better than expected earnings, but the market has moved well ahead of earnings. Even though the 12 month forward earnings for the S&P 500 has increased only +0.1% since the end of the quarter, the S&P 500 has increased +2.0%. The P/E ratio has increased from 17.4 times to 17.8 times forward earnings; this valuation is well above the 16.9 ratio at year end or the 5-year average of 15.4 or the 10-year average of 14.0 times forward earnings. Equity Indices % Change | Price | Week | QTD | YTD | '08-'16 | | 07 /21/ 17 | 07 /14/ 17 | 06 /30/ 17 | 12/30/16 | 12/31/08 | Dow Jones Industrials | 21,580 | -0.3% | 1.1% | 9.2% | 125.2% | S&P 500 Index | 2,473 | 0.5% | 2.0% | 10.4% | 147.9% | Nasdaq | 6,388 | 1.2% | 4.0% | 18.7% | 241.3% | S&P/TSX Composite | 15,183 | 0.1% | 0.0% | -0.7% | 70.1% | FTSE 100 Index | 7,453 | 1.0% | 1.9% | 4.3% | 61.1% | CAC 40 Index | 5,118 | -2.2% | -0.1% | 5.3% | 51.1% | DAX Index | 12,240 | -3.1% | -0.7% | 6.6% | 138.7% | Swiss Market Index | 8,939 | -1.1% | 0.4% | 8.7% | 48.5% | Nikkei 225 Index | 20,100 | -0.1% | 0.3% | 5.2% | 115.7% | HK Hang Seng Index | 26,706 | 1.2% | 3.7% | 21.4% | 52.9% | Shanghai CSI 300 | 3729 | 0.7% | 1.7% | 12.6% | 82.1% | Bond Indices % Total Return | | | | | | Bloomberg Treasury Index | 127.1 | 0.5% | 0.5% | 2.4% | 19.5% | Bloomberg Corporate Index | 150.7 | 0.8% | 1.0% | 4.9% | 72.1% | Bloomberg High Yield Index | 180.0 | 0.6% | 0.9% | 6.0% | 167.4% | S&P 500 Valuation | | | | | | Factset forward Earnings | $139.10 | | $134.91 | $132.79 | 5-Year Ave | % Change in Earnings | | | 0.1% | 4.8% | 15.4 | | | | | | 10-Year Ave | Price/Earnings Ratio | 17.8 | | 17.4 | 16.9 | 14.0 |
Data Source: Bloomberg app for the Iphone; Earning Estimates from Factset |
Bond Yields and Spreads: Both Government Bond yields and credit spreads dropped across the globe this week. The TIPS spread, one measure of inflationary expectations, dropped 2 basis points to 1.79 this week, 19 basis points lower than it was at year end. Another measure of inflationary expectations, the Yield Curve (2's to 30's) dropped 9 basis points on the week, also 41 basis point lower than at year end. Government Bonds | Bond Yields (%) | bp chg | QTD | YTD | '08-'16 | | 07 /21/ 17 | 07 /14/ 17 | 06 /30/ 17 | 12/30/16 | 12/31/08 | UST 2-Year | 1.34 | -2 | -4 | 15 | 42 | UST 10-Year | 2.24 | -9 | -6 | -20 | 23 | US TIP 10-Year | 0.46 | -7 | -9 | -1 | -163 | UST 30-Year | 2.81 | -11 | -2 | -26 | 39 | Canadian 10-Year | 1.88 | -1 | 11 | 17 | -97 | UK 10-Year | 1.17 | -14 | -8 | -6 | -179 | French 10-Year | 0.75 | -10 | -6 | 7 | -273 | German 10-Year | 0.50 | -9 | 4 | 30 | -275 | Swiss 10-Year | -0.06 | -2 | 1 | 20 | -236 | Japan 10-Year | 0.06 | -1 | -1 | 2 | -113 | Bloomberg Credit Spreads | | bp chg | bp chg | bp chg | bp chg | Corp OAS BUSC | 107 | -2 | -6 | -22 | -445 | HY OAS BUHY | 368 | -11 | -8 | -60 | -1374 | Rates | | bp chg | bp chg | bp chg | bp chg | US Mort 30-yr % | 3.84 | -1 | -1 | -25 | -117 | Spreads | | | | | | 10-Year TIPS Spread | 1.79 | -2 | 3 | -19 | 185 | Yield Curve (2's to 10's) | 0.90 | -7 | -2 | -35 | -20 | Yield Curve (10's to 30's) | 0.57 | -2 | 4 | -6 | 17 | Yield Curve (2's to 30's) | 1.47 | -9 | 2 | -41 | -3 |
Data Source: Bloomberg app for the Iphone |
Currency and Commodity Markets: With exception of the Yen, the US dollar weakened against each of the other currencies in the table this week. Energy prices fell, but metals and Corn commodity prices rose on the week. Currencies vs $ | Closing | Week | QTD | YTD | '08-'16 | | 07 /21/ 17 | 07 /14/ 17 | 06 /30/ 17 | 12 /30/ 16 | 12 /31/ 08 | Yen | 89.98 | 1.3% | 1.2% | 5.2% | -22.5% | British Pound | 1.30 | -0.8% | -0.2% | 5.5% | -15.5% | Euro | 1.17 | 1.7% | 2.1% | 10.9% | -24.7% | Canadian Dollar | 79.75 | 0.8% | 3.4% | 7.1% | -9.5% | China Renminbi | 14.78 | 0.1% | 0.2% | 2.6% | -1.6% | Commodities | | | | | | WTI | $45.77 | -1.7% | -1.0% | -15.0% | 20.7% | Brent Crude | $48.02 | -2.0% | -1.7% | -15.5% | 58.6% | Natural Gas | $2.97 | -0.3% | 0.6% | -20.6% | -35.6% | Spot Gold | $1255 | 2.1% | 1.2% | 9.0% | 32.4% | Spot Silver | $16.52 | 3.7% | -0.5% | 3.6% | 40.7% | CBOT Corn | $393.50 | 4.6% | 1.5% | 11.8% | -2.1% | Spreads | | | | | | Brent-WTI | $2.25 | $2.48 | $2.63 | $2.98 | -$8.78 |
Data Source: Bloomberg app for the Iphone |
Equity Index Gains in US dollar terms: The equity table above shows the percent change of different stock indices in terms of its local currency. To calculate the return to the US dollar investor one must combine the change of each index with the change in the applicable currency. The following table shows the 5-day, quarter-to-date and year-to-date results of investments made in each index in US dollar terms: Return to USD Investor | | % Chg | QTD | YTD | | 07 /21/ 17 | since: | 07 /14/ 17 | 06 /30/ 17 | 12/30/16 | '08-'16 | S&P 500 Index: | USD | 0.5% | 2.0% | 10.4% | 147.9% | Nikkei 225 Index: | Yen | 1.2% | 1.5% | 10.7% | 67.3% | FTSE 100 Index: | Pound | 0.2% | 1.7% | 10.0% | 36.0% | DAX Index: | Euro | -1.4% | 1.4% | 18.3% | 79.7% | CAC 40 Index: | Euro | -0.6% | 2.1% | 16.7% | 13.7% | S&P/TSX Composite: | CAD | 0.9% | 3.4% | 6.4% | 54.0% | Shanghai CSI 300: | Yuan | 0.8% | 1.9% | 15.6% | 82.1% |
For US dollar investors, the Nikkei and TSX generated better returns than the S&P 500 this week. |
Disclaimer: The views discussed herein are exclusively those of John W. Davidson. These views are not meant as investment advice, and are subject to change. Information contained herein is derived from sources believed to be reliable, however, Mr. Davidson does not represent that the information is complete or accurate and therefore, should not be relied upon as such. All opinions expressed herein are subject to change without notice. This information is prepared for general information purposes only, and does not pertain to specific investment objectives, the financial situation or the particular needs of any specific person or investor who might receive this report. Investors should seek financial advice regarding the appropriateness of investing in any security or utilizing any investment strategy discussed or recommended in this report, and should understand that statements regarding future investment prospects may not be realized. |
|


