Dept. of Labor: Maine’s unemployment rate remains steady at 3.3 percent
 These estimates are derived from two monthly surveys. The Current Population Survey collects information from households on labor force status, including labor force participation, employment, and unemployment. The Current Employment Statistics survey collects information from nonfarm employers by industry on the number of wage and salary jobs, hours worked, and wages paid to individuals on their payrolls. Both surveys are administered by the U.S. Bureau of Labor Statistics. Preliminary estimates from the two surveys sometimes diverge in direction or magnitude of change. Over extended periods they tend to be more aligned.
 These estimates are derived from two monthly surveys. The Current Population Survey collects information from households on labor force status, including labor force participation, employment, and unemployment. The Current Employment Statistics survey collects information from nonfarm employers by industry on the number of wage and salary jobs, hours worked, and wages paid to individuals on their payrolls. Both surveys are administered by the U.S. Bureau of Labor Statistics. Preliminary estimates from the two surveys sometimes diverge in direction or magnitude of change. Over extended periods they tend to be more aligned.
The Maine Department of Labor issued its March 2024 report, noting little change in labor market conditions in March. Nonfarm jobs were the second highest on record, and the unemployment rate was 3.3 percent.
Statewide Seasonally Adjusted Labor Force Estimates
The preliminary 3.3 percent unemployment rate was little changed from 3.4 percent for the prior five months. The three-month average for the period through March was unchanged from the previous three months through December.
Unemployment has been below four percent for 28 months – the second longest such period – and below the U.S. average for all but two months in more than 16 years, according to Maine’s DOL Unemployment remained below the long-term average of 5.5 percent for the state since January 1976 when the current methodology was adopted.
Unemployment averaged 3.3 percent for New England and 3.8 percent for the U.S. in March.
| Over the Month Change in Labor Force (Seasonally Adjusted) | ||||||
|---|---|---|---|---|---|---|
| Metric | Feb | Mar | Change | |||
| Labor Force Participation Rate | 59.3% | 59.3% | 0.0% | |||
| Employment to Population Ratio | 57.3% | 57.4% | 0.1% | |||
| Unemployment Rate | 3.4% | 3.3% | -0.1% | |||
| Three-Month Average Labor Force (Seasonally Adjusted) | ||||||
|---|---|---|---|---|---|---|
| Metric | Oct to Dec | Jan to Mar | Change | |||
| Labor Force Participation Rate | 59.4% | 59.3% | -0.1% | |||
| Employment to Population Ratio | 57.3% | 57.3% | 0.0% | |||
| Unemployment Rate | 3.4% | 3.4% | 0.0% | |||
Statewide Seasonally Adjusted Nonfarm Jobs Estimates
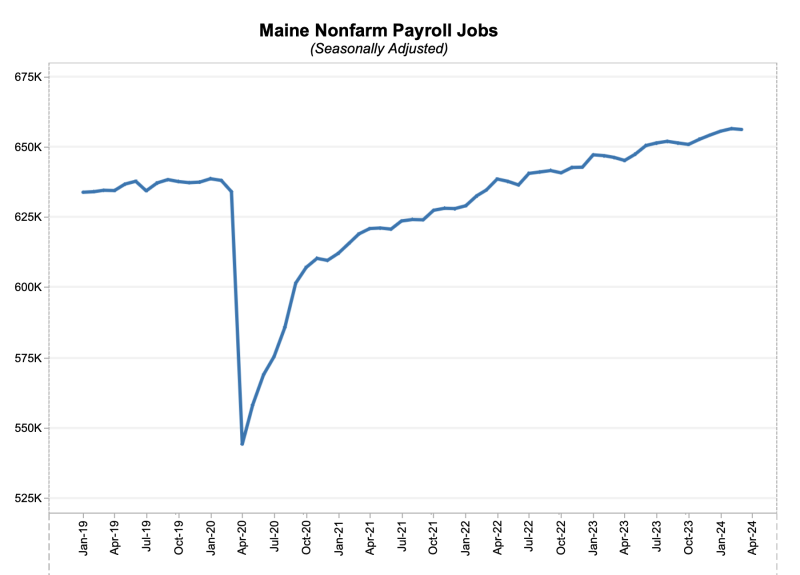
The preliminary estimate of 656,100 nonfarm wage and salary jobs was little changed in the month, down 300 after a small upward revision for February. March had the second most jobs on record. Jobs increased 9,900 over the year, an average of 800 per month. About 60 percent of the over the year gain was in healthcare and social assistance after a slower than average recovery in that sector the first two years after the pandemic’s onset.
| Industry | Jobs (in thousands) | Change in Jobs | ||||||||
|---|---|---|---|---|---|---|---|---|---|---|
| 2023 | 2024 | Share of Jobs | Over the Month | Over the Year | ||||||
| Mar | Feb | Mar | Mar 23 | Mar 24 | Net | Percent | Monthly Average | Net | Percent | |
| Total Nonfarm | 646.2 | 656.4 | 656.1 | 100% | 100% | -0.3 | 0.0% | 0.8 | 9.9 | 1.5% |
| Total Private | 547.1 | 555.0 | 554.4 | 84.7% | 84.5% | -0.6 | -0.1% | 0.6 | 7.3 | 1.3% |
| Healthcare & Social Assistance | 105.6 | 111.6 | 111.5 | 16.3% | 17.0% | -0.1 | -0.1% | 0.5 | 5.9 | 5.6% |
| Retail Trade | 81.4 | 82.3 | 82.2 | 12.6% | 12.5% | -0.1 | -0.1% | 0.1 | 0.8 | 1.0% |
| Professional & Business Services | 76.6 | 78.0 | 77.3 | 11.9% | 11.8% | -0.7 | -0.9% | 0.1 | 0.7 | 0.9% |
| Leisure & Hospitality | 68.3 | 68.7 | 68.5 | 10.6% | 10.4% | -0.2 | -0.3% | 0.0 | 0.2 | 0.3% |
| Manufacturing | 54.3 | 53.7 | 54.0 | 8.4% | 8.2% | 0.3 | 0.6% | 0.0 | -0.3 | -0.6% |
| Construction | 33.6 | 33.8 | 34.2 | 5.2% | 5.2% | 0.4 | 1.2% | 0.1 | 0.6 | 1.8% |
| Financial Activities | 33.8 | 33.6 | 33.7 | 5.2% | 5.1% | 0.1 | 0.3% | 0.0 | -0.1 | -0.3% |
| Educational Services | 22.5 | 22.9 | 22.5 | 3.5% | 3.4% | -0.4 | -1.7% | 0.0 | 0.0 | 0.0% |
| Other Services | 22.2 | 21.9 | 21.8 | 3.4% | 3.3% | -0.1 | -0.5% | 0.0 | -0.4 | -1.8% |
| Transportation, Warehousing & Utilities | 19.0 | 19.1 | 19.4 | 2.9% | 3.0% | 0.3 | 1.6% | 0.0 | 0.4 | 2.1% |
| Wholesale Trade | 19.6 | 19.1 | 19.1 | 3.0% | 2.9% | 0.0 | 0.0% | 0.0 | -0.5 | -2.6% |
| Information | 8.2 | 8.2 | 8.2 | 1.3% | 1.2% | 0.0 | 0.0% | 0.0 | 0.0 | 0.0% |
| Mining & Logging | 2.0 | 2.1 | 2.0 | 0.3% | 0.3% | -0.1 | -4.8% | 0.0 | 0.0 | 0.0% |
| Government | 99.1 | 101.4 | 101.7 | 15.3% | 15.5% | 0.3 | 0.3% | 0.2 | 2.6 | 2.6% |
| Local | 59.8 | 61.3 | 61.3 | 9.3% | 9.3% | 0.0 | 0.0% | 0.1 | 1.5 | 2.5% |
| State | 22.5 | 23.0 | 23.1 | 3.5% | 3.5% | 0.1 | 0.4% | 0.1 | 0.6 | 2.7% |
| Federal | 16.8 | 17.1 | 17.3 | 2.6% | 2.6% | 0.2 | 1.2% | 0.0 | 0.5 | 3.0% |
| Industries in decending order by current month jobs. | ||||||||||
Not Seasonally Adjusted County and Metro Labor Force Estimates
On a not seasonally adjusted basis the statewide unemployment rate was 3.2 percent. Rates were at least 0.3 percentage points higher than that in eight counties, at least 0.3 points lower than that in three, and close to the average in five. The lowest rates were in southern and central areas and the highest were in the north.
Among the three metro areas of the state, unemployment was below the statewide average in Portland-S. Portland and close to the average in Bangor and Lewiston-Auburn.
(Labor force estimates for substate areas, including unemployment rates, are not seasonally adjusted. Because of this, estimates for a certain month should be compared to the same month in other years and should not be compared to other months in the same or other years.)
| March Labor Force Estimates (not seasonally-adjusted) | ||||||
|---|---|---|---|---|---|---|
| Area | Employed | Unemployed | Unemployment Rate | |||
| 2023 | 2024 | 2023 | 2024 | 2023 | 2024 | |
| Maine | 656,230 | 666,270 | 20,540 | 22,000 | 3.0% | 3.2% |
| U.S. (in thousands) | 160,740 | 161,360 | 6,040 | 6,600 | 3.6% | 3.9% |
| Counties | ||||||
| Androscoggin | 52,020 | 52,500 | 1,650 | 1,670 | 3.1% | 3.1% |
| Aroostook | 27,340 | 27,520 | 1,160 | 1,310 | 4.1% | 4.5% |
| Cumberland | 159,840 | 161,520 | 3,900 | 4,190 | 2.4% | 2.5% |
| Franklin | 13,610 | 13,690 | 470 | 560 | 3.4% | 3.9% |
| Hancock | 25,410 | 26,070 | 1,190 | 1,200 | 4.5% | 4.4% |
| Kennebec | 60,270 | 61,570 | 1,620 | 1,750 | 2.6% | 2.8% |
| Knox | 18,590 | 19,040 | 640 | 700 | 3.3% | 3.6% |
| Lincoln | 15,480 | 15,780 | 520 | 540 | 3.3% | 3.3% |
| Oxford | 25,300 | 25,800 | 850 | 920 | 3.3% | 3.5% |
| Penobscot | 71,400 | 73,030 | 2,270 | 2,580 | 3.1% | 3.4% |
| Piscataquis | 6,730 | 6,750 | 320 | 380 | 4.5% | 5.3% |
| Sagadahoc | 18,640 | 18,760 | 460 | 480 | 2.4% | 2.5% |
| Somerset | 20,830 | 21,250 | 1,060 | 960 | 4.9% | 4.3% |
| Waldo | 19,190 | 19,560 | 690 | 670 | 3.4% | 3.3% |
| Washington | 12,360 | 12,670 | 620 | 680 | 4.7% | 5.1% |
| York | 109,230 | 110,790 | 3,110 | 3,420 | 2.8% | 3.0% |
| Metropolitian Areas | ||||||
| Bangor | 66,250 | 67,720 | 1,890 | 2,140 | 2.8% | 3.1% |
| Lewiston-Auburn | 52,360 | 52,860 | 1,660 | 1,680 | 3.1% | 3.1% |
| Portland-S Portland | 202,300 | 204,450 | 5,030 | 5,510 | 2.4% | 2.6% |
Not Seasonally Adjusted Statewide and Metro Area Hours and Earnings Estimates
The private sector workweek averaged 33.1 hours and earnings averaged $31.24 per hour in March. Average hours decreased 0.3 and hourly earnings increased 4.5 percent from a year ago. Earnings increases were led by a 6.9 percent gain in manufacturing. The workweek was longest in construction and shortest in leisure and hospitality. Earnings were highest in professional and business services and lowest in leisure and hospitality.
Hourly earnings were higher than the statewide average in the Portland-S. Portland metro and slightly lower in the Bangor and Lewiston-Auburn metros.
| March Average Hours and Earnings Estimates (not seasonally-adjusted) | ||||||
|---|---|---|---|---|---|---|
| Sector/Area | Weekly Hours | Hourly Earnings | ||||
| 2023 | 2024 | Change | 2023 | 2024 | % Change | |
| Maine | 33.4 | 33.1 | -0.3 | $29.90 | $31.24 | 4.5% |
| United States | 34.2 | 34.2 | 0.0 | $33.26 | $34.64 | 4.1% |
| Sectors Statewide | ||||||
| Construction | 38.4 | 38.8 | 0.4 | $30.22 | $32.00 | 5.9% |
| Manufacturing | 39.3 | 37.9 | -1.4 | $28.60 | $30.58 | 6.9% |
| Trade, Transportation & Utilities | 32.0 | 31.9 | -0.1 | $25.49 | $26.32 | 3.3% |
| Professional & Business Services | 34.4 | 34.8 | 0.4 | $34.90 | $36.16 | 3.6% |
| Education & Health Services | 33.2 | 32.7 | -0.5 | $32.82 | $33.99 | 3.6% |
| Leisure & Hospitality | 28.0 | 26.0 | -2.0 | $22.77 | $22.82 | 0.2% |
| Metropolitian Areas, Private Sector | ||||||
| Bangor | 33.6 | 34.3 | 0.7 | $28.01 | $29.89 | 6.7% |
| Lewiston-Auburn | 34.4 | 34.1 | -0.3 | $27.84 | $29.17 | 4.8% |
| Portland-S Portland | 32.5 | 32.4 | -0.1 | $32.87 | $34.00 | 3.4% |
February workforce estimates will be published Friday, May 17 at 10 a.m. The data release schedule is here.
Nonfarm jobs data is available here.
Unemployment and labor force data is available here.
Notes:
- Preliminary seasonally-adjusted labor force estimates, including rates (labor force participation, employment, and unemployment rates), and levels (labor force, employed, and unemployed), as well as nonfarm wage and salary job estimates are inexact. Annual revisions (published in March each year) add accuracy. A comparison of 2022 and 2023 revised and previously published estimates is available in this blog.
- The 90 percent confidence interval for the statewide seasonally adjusted unemployment rate for March was between 2.6 and 4.0 percent.
- Nonfarm wage and salary jobs from the payroll survey provide a better indication of changes in employment than resident employment from the household survey. The payroll survey is larger and has smaller margins of error.
- Nonfarm payroll jobs estimates tend to be variable from month to month because the representativeness of reporting employers can differ. Seasonal adjustment is imperfect because weather, the beginning and ending of school semesters, and other events do not always occur with the same timing relative to the pay period that includes the 12th day of the month, which is the survey reference period. This sometimes exacerbates monthly changes in jobs estimates. Users should look to the trend over multiple months rather than the change from one specific month to another. Jobs estimates for the period from April 2023 to September 2024 will be replaced with payroll data in March 2024. Those benchmark revisions usually show less monthly variability than previously published estimates.


