Where the Belfast tax dollar went in 1931, 1952, 2004 ...
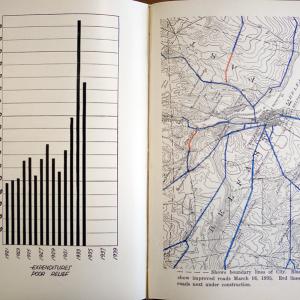
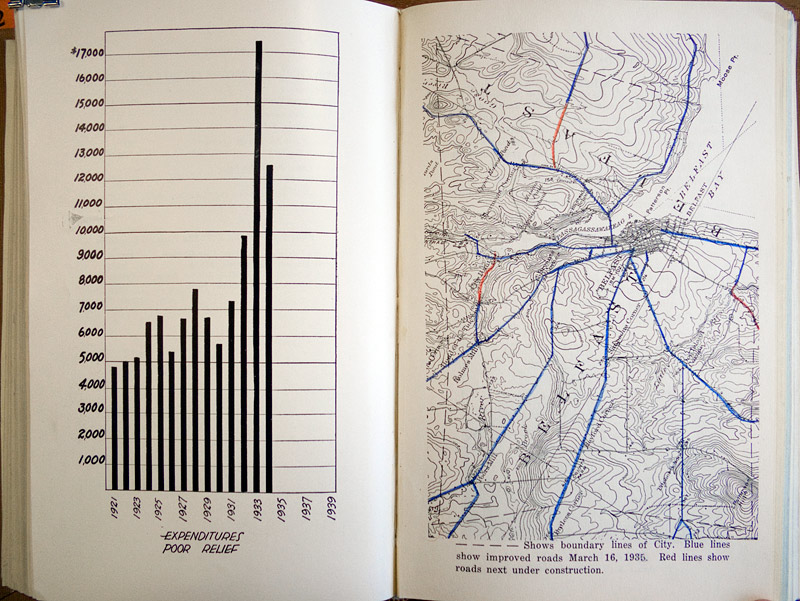 Graphics from Belfast's annual report of 1934-35 show a spike in expenditures on the poor and illustrate improved and new city roads. A sampling of other images from past city reports, including many on the theme of how tax money is spent, is reproduced below. (Photos by Ethan Andrews, Source: Belfast Free Library)
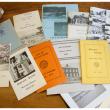
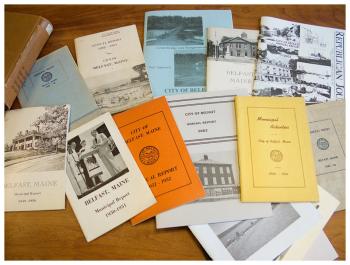
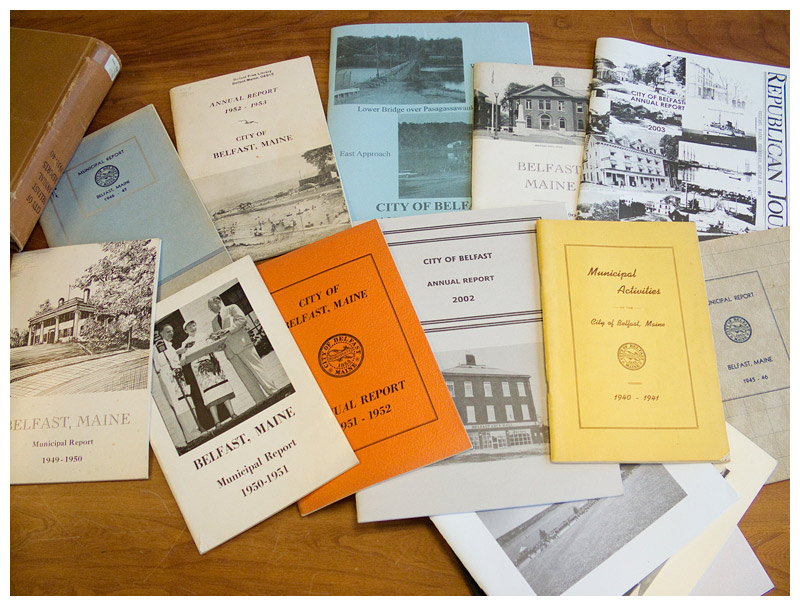 A selection of Belfast's annual reports from the collection of the Belfast Free Library.
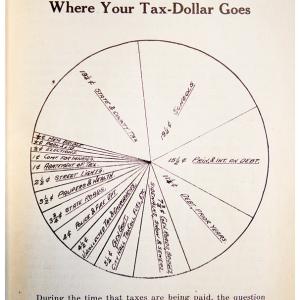
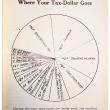
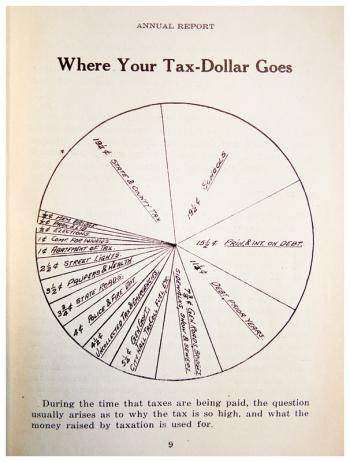
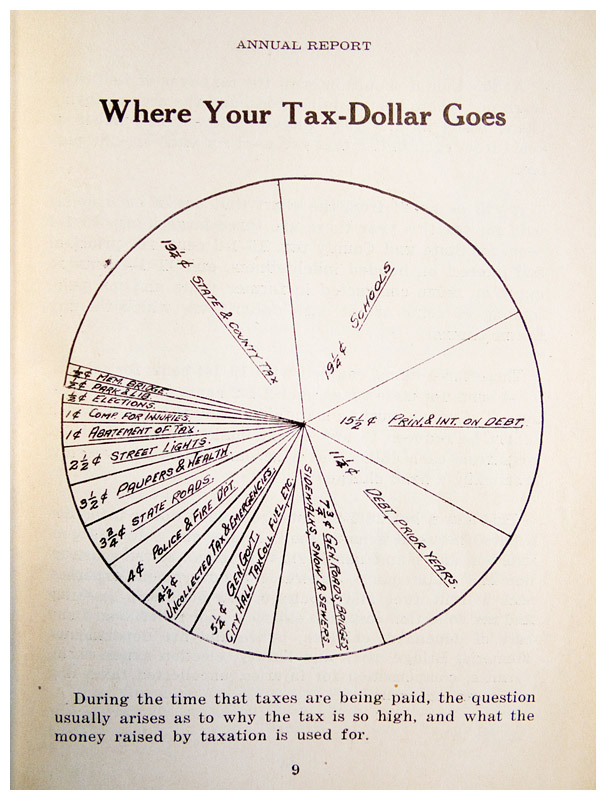 A pie chart from the 1930-31 annual report, the first to include graphics alongside the traditional text.
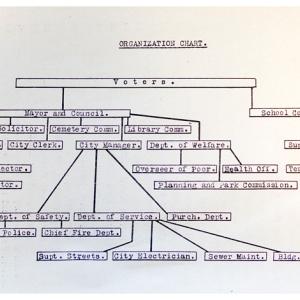
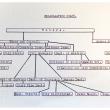
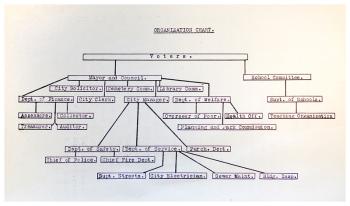
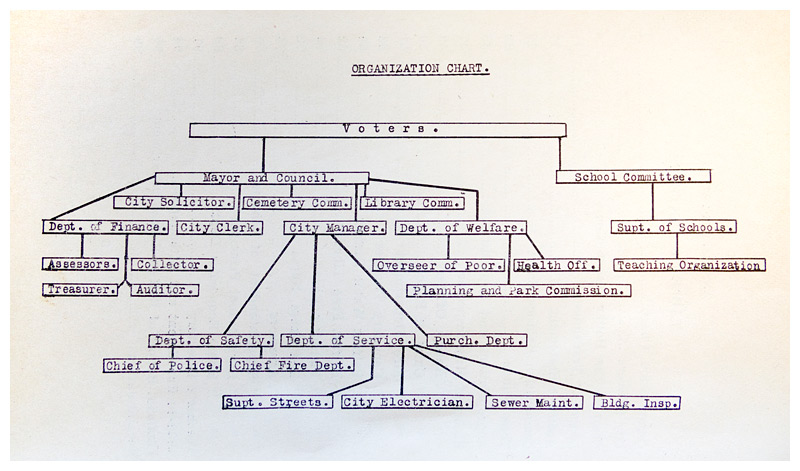 First printed in 1930-31, this chart of city government hierarchy was reproduced in the city's annual reports until the early 1950s.
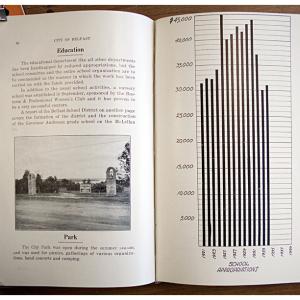
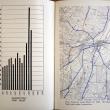
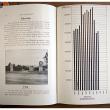
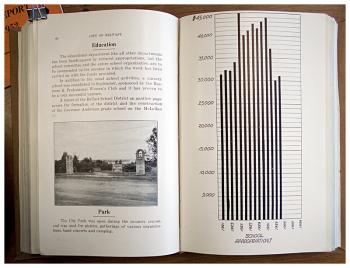
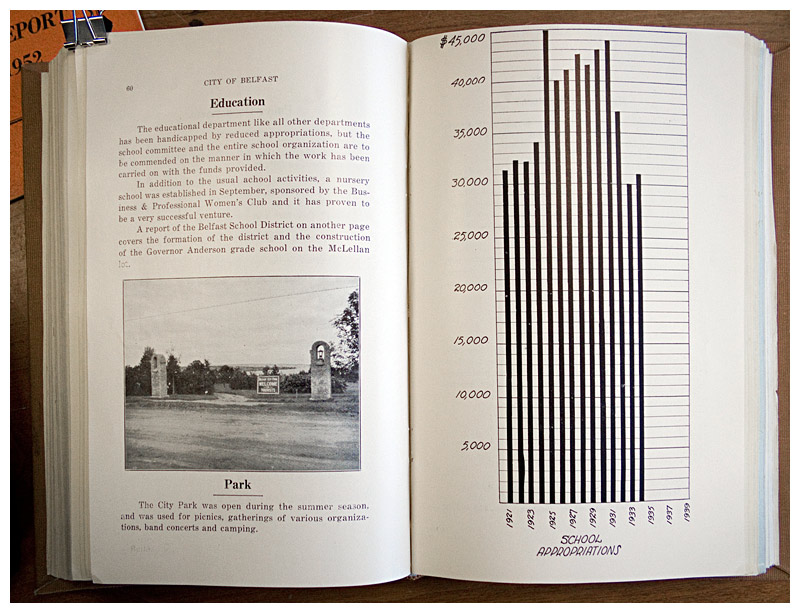 A photo of entrance to City Park, which was new at the time, and a graph of school appropriations from the 1934-35 report.
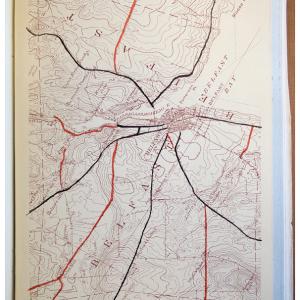
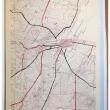
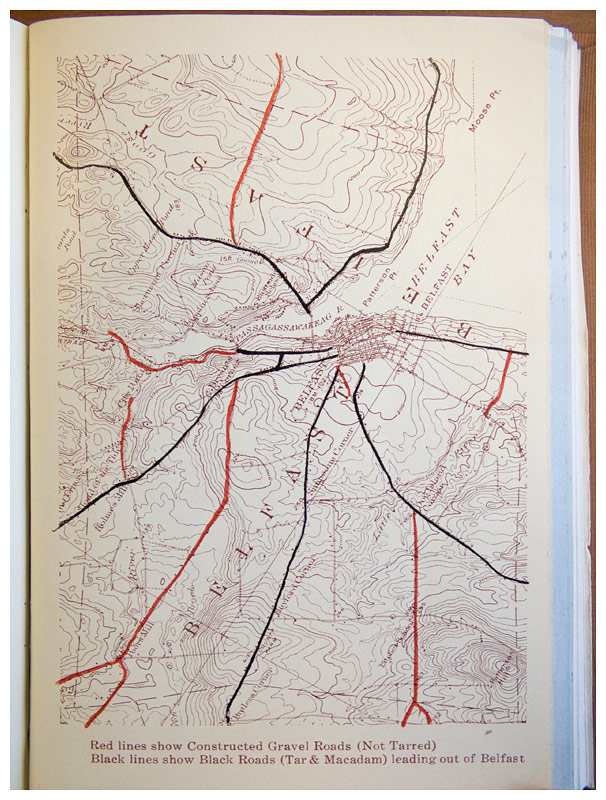 A color map showing improved and new roads, from the city's 1934-35 annual report.
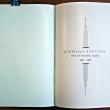
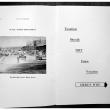
 The cover the 1937-38 annual report, from a bound volume at the Belfast Free Library.
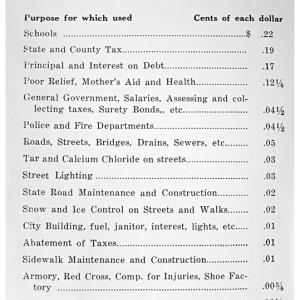
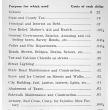
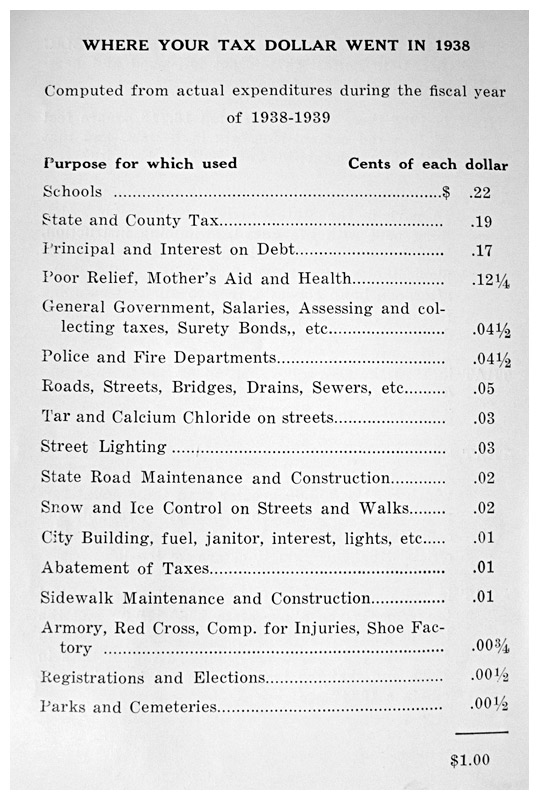 A listed breakdown of tax expenditures from the 1938-39 annual report.
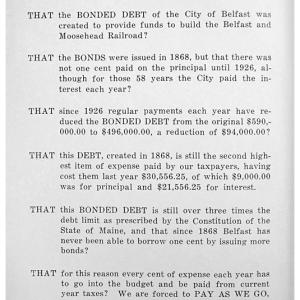
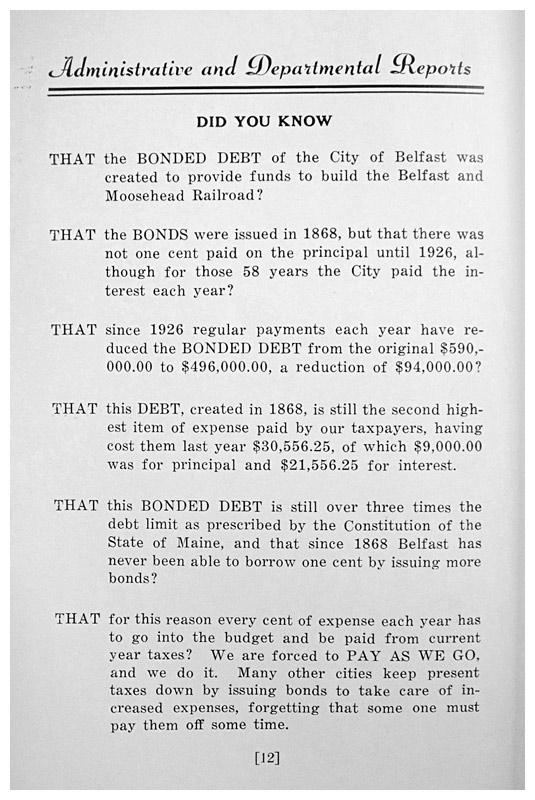 The didactic tone and bold layout of this explanation of bonded indebtedness from the 1938-39 report suggests it was meant for a broad audience.
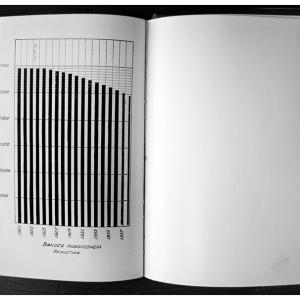
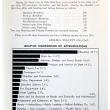
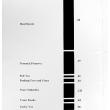
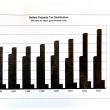
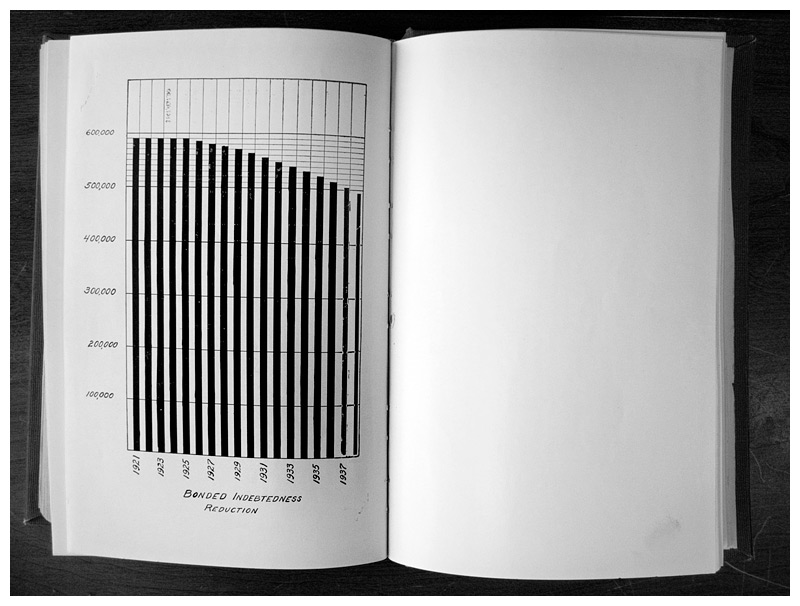 A bar graph from an annual report in the mid-1930s.
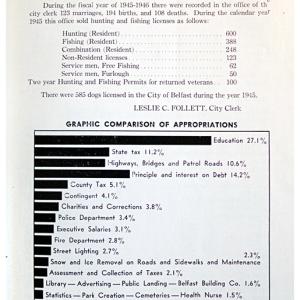
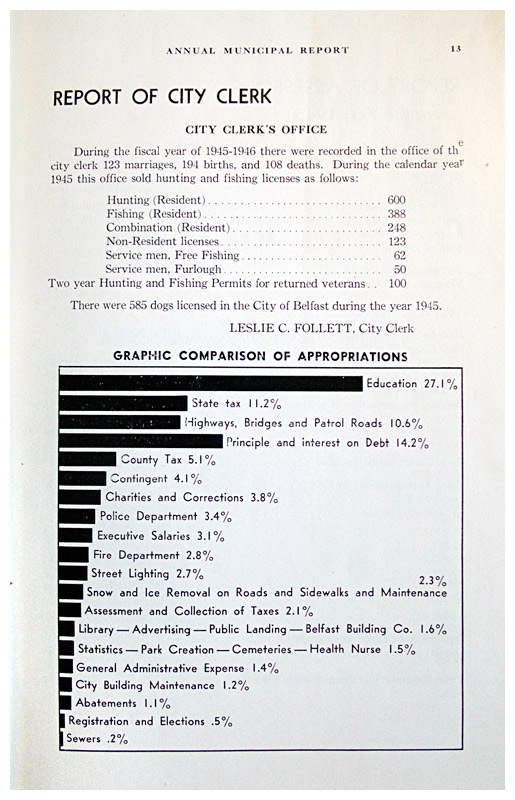 A display of tax expenditures from the 1945-46 annual report.
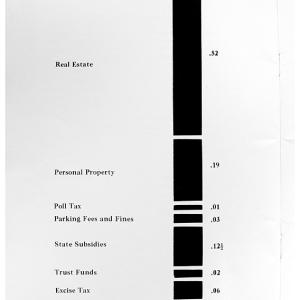
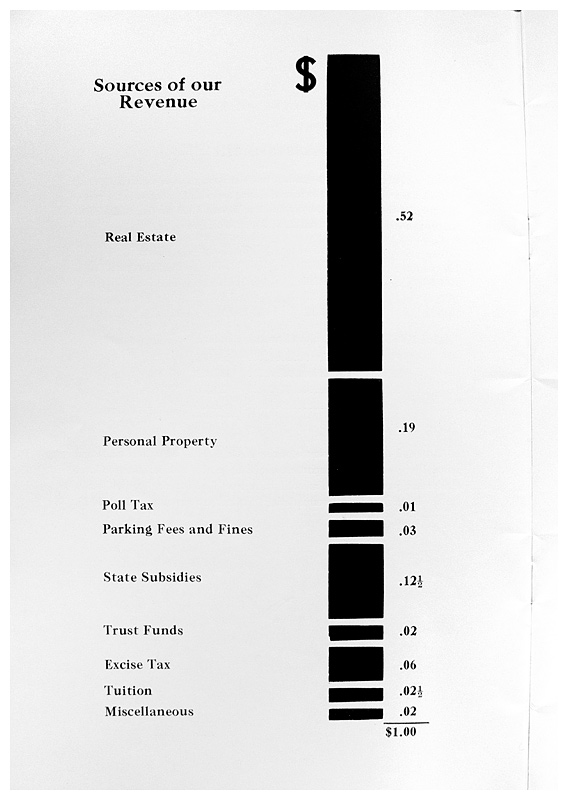 From the 1951-52 report, another variation on theme of the tax dollar.
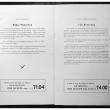
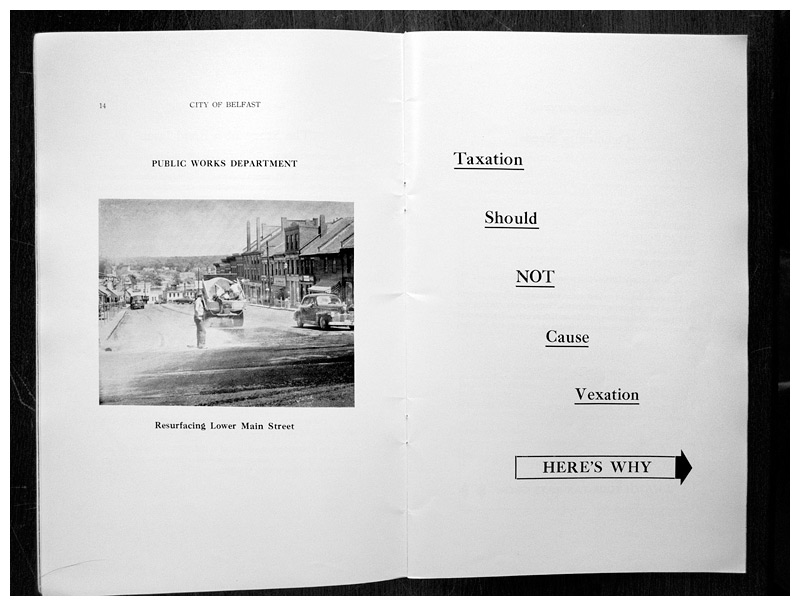 A new city manager likely had something to do with the ambitious narrative in the 1952-53 report, which played out over ten arguably harrowing pages (see next four images).
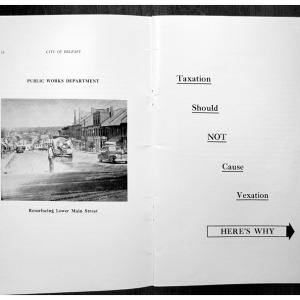
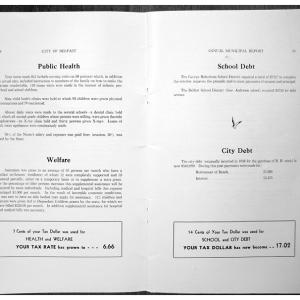
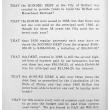
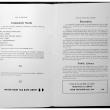
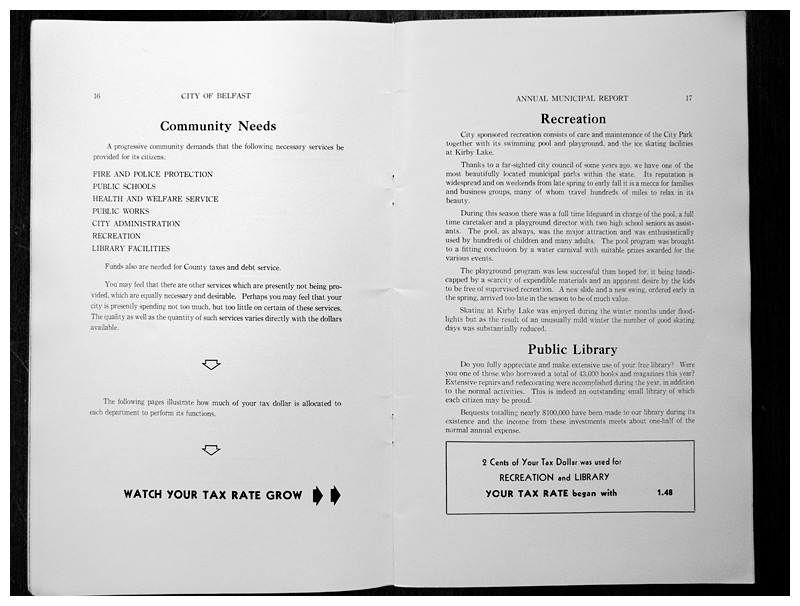 Pages 3 and 4 of a section of the 1952-53 report in which residents are invited to "WATCH YOUR TAX RATE GROW."
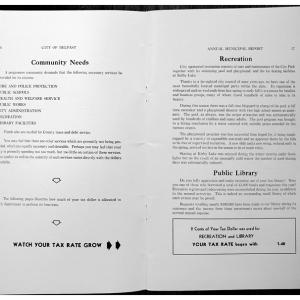
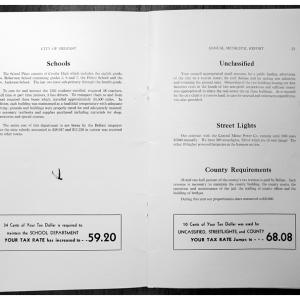
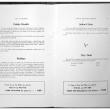
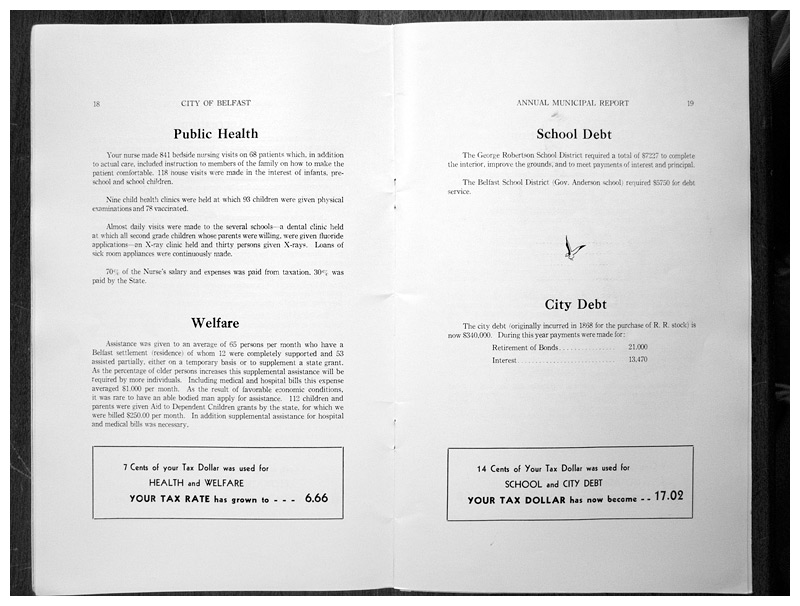 Pages 5 and 6 of a section of the 1952-53 report detailing the services that contribute to the city's tax rate.
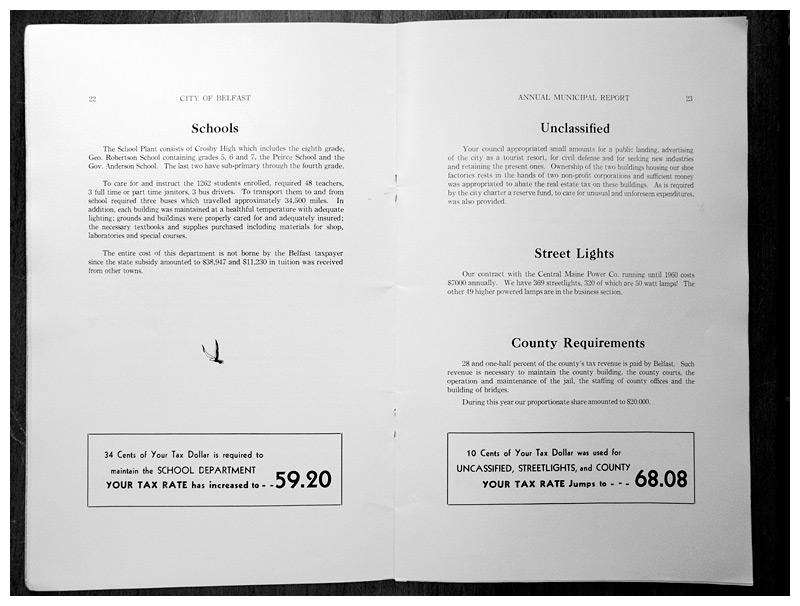 Pages 9 and 10 of a section of the 1952-53 report detailing the services that contribute to the city's tax rate.
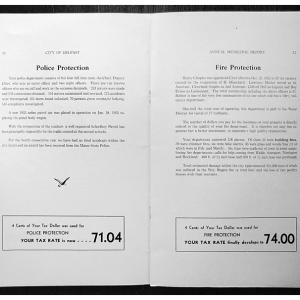
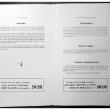
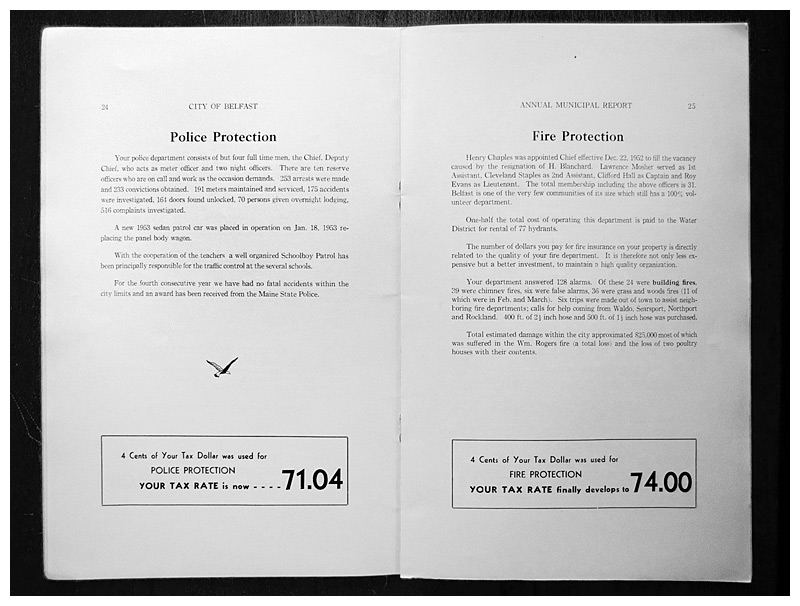 Pages 11 and 12 of a section of the 1952-53 report detailing the services that contribute to the city's tax rate.
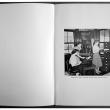
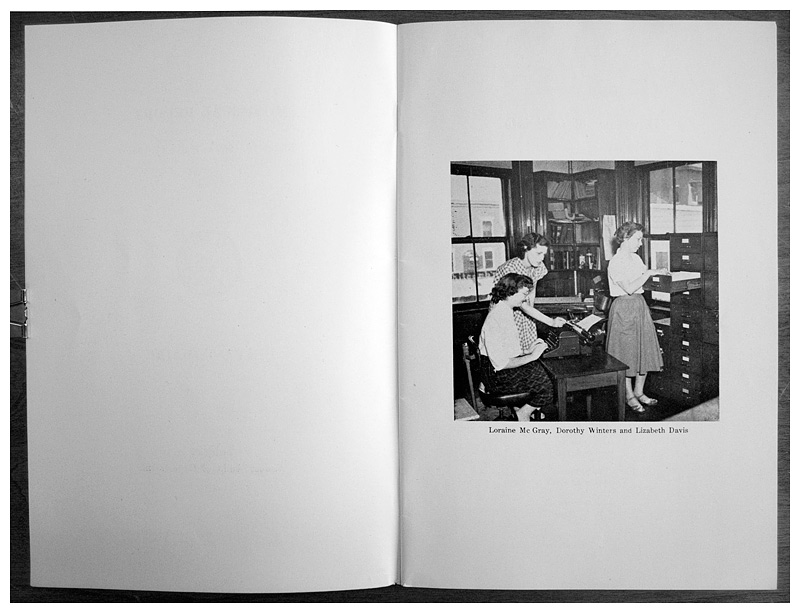 The inside cover of an annual report from the 1950s shows city staff members at work. Photographs, initially of public works and workers, and later of civic life and scenery, became increasingly common in later copies of the annual report.
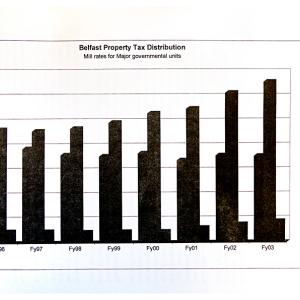
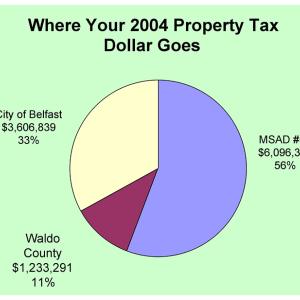
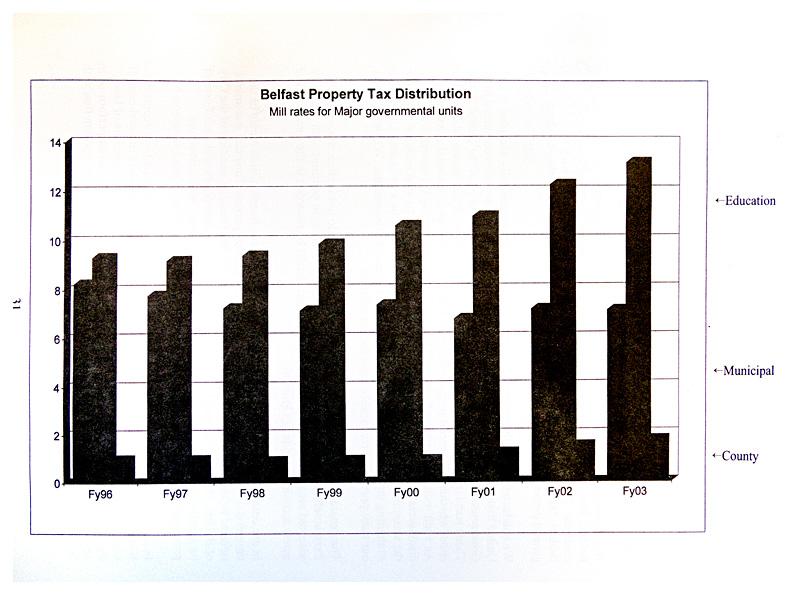 In recent years, city officials used graphics like this one to distance themselves from county and school district budgets, which factor in local tax rates but are outside of city control.
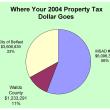
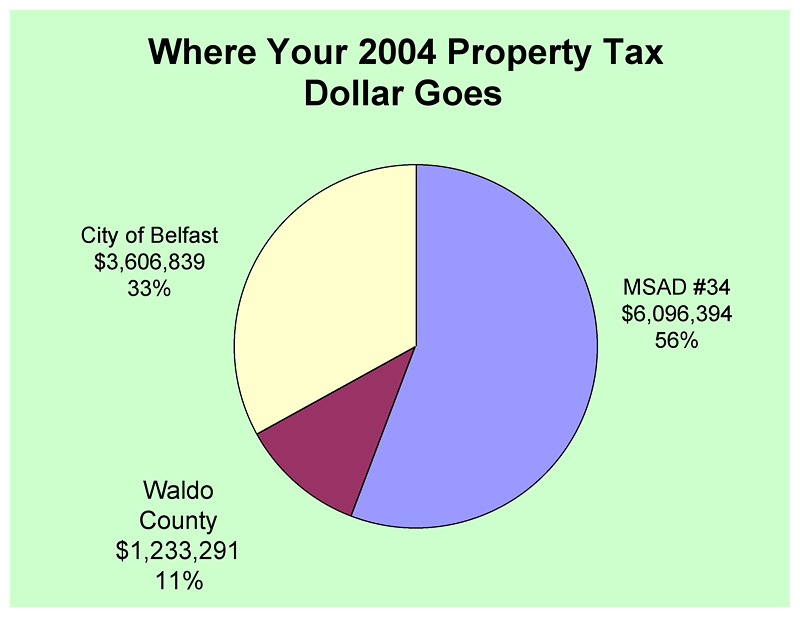 The title and pie chart format of a 2004 graphic distributed within City Hall echo the one from 1930-31, but with the contemporary focus on city, county and school taxes.
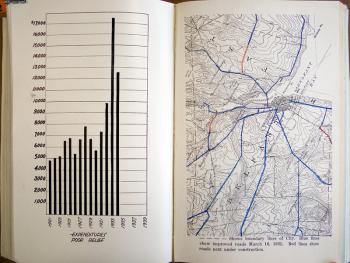 Graphics from Belfast's annual report of 1934-35 show a spike in expenditures on the poor and illustrate improved and new city roads. A sampling of other images from past city reports, including many on the theme of how tax money is spent, is reproduced below. (Photos by Ethan Andrews, Source: Belfast Free Library)
 A selection of Belfast's annual reports from the collection of the Belfast Free Library.
 A pie chart from the 1930-31 annual report, the first to include graphics alongside the traditional text.
 First printed in 1930-31, this chart of city government hierarchy was reproduced in the city's annual reports until the early 1950s.
 A photo of entrance to City Park, which was new at the time, and a graph of school appropriations from the 1934-35 report.
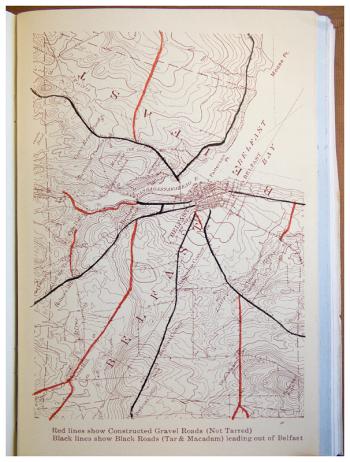 A color map showing improved and new roads, from the city's 1934-35 annual report.
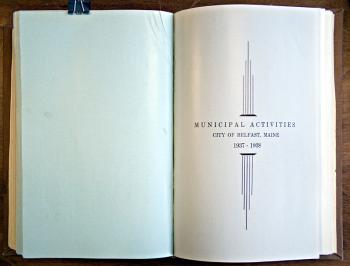 The cover the 1937-38 annual report, from a bound volume at the Belfast Free Library.
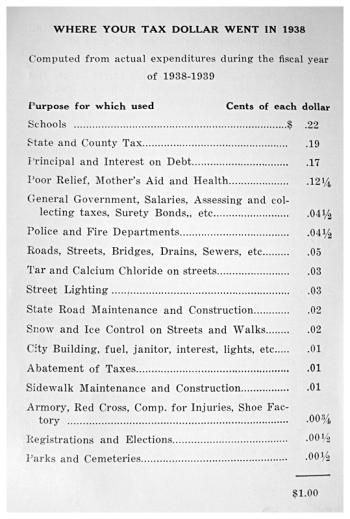 A listed breakdown of tax expenditures from the 1938-39 annual report.
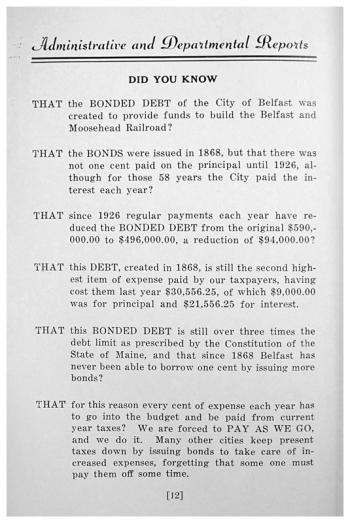 The didactic tone and bold layout of this explanation of bonded indebtedness from the 1938-39 report suggests it was meant for a broad audience.
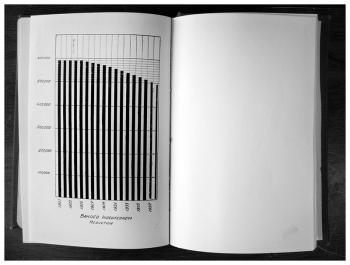 A bar graph from an annual report in the mid-1930s.
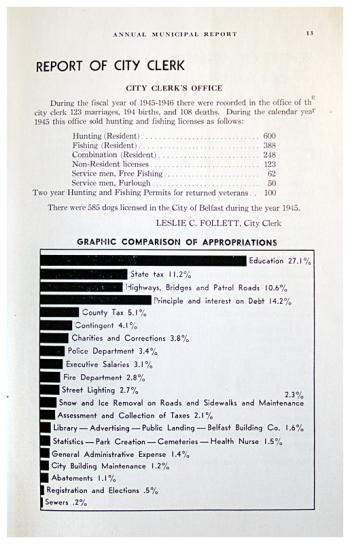 A display of tax expenditures from the 1945-46 annual report.
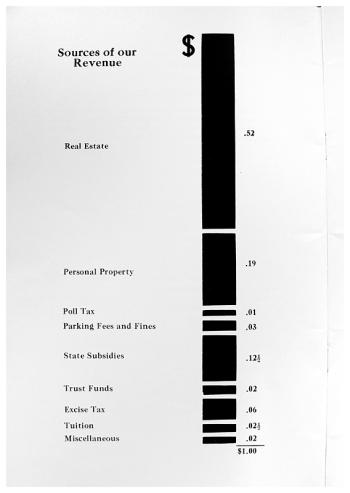 From the 1951-52 report, another variation on theme of the tax dollar.
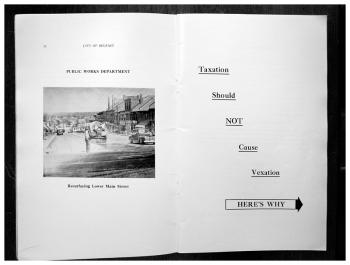 A new city manager likely had something to do with the ambitious narrative in the 1952-53 report, which played out over ten arguably harrowing pages (see next four images).
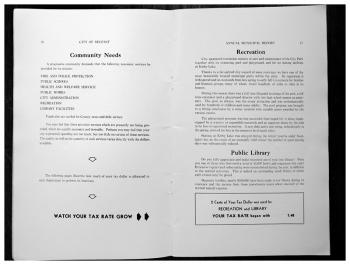 Pages 3 and 4 of a section of the 1952-53 report in which residents are invited to "WATCH YOUR TAX RATE GROW."
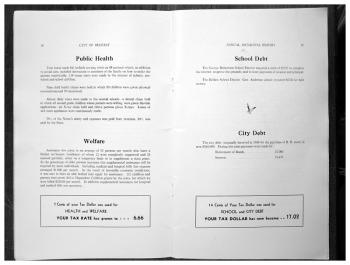 Pages 5 and 6 of a section of the 1952-53 report detailing the services that contribute to the city's tax rate.
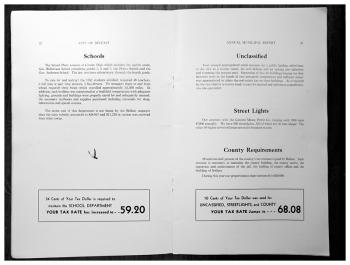 Pages 9 and 10 of a section of the 1952-53 report detailing the services that contribute to the city's tax rate.
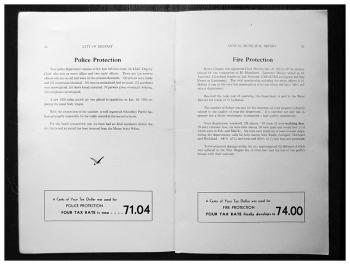 Pages 11 and 12 of a section of the 1952-53 report detailing the services that contribute to the city's tax rate.
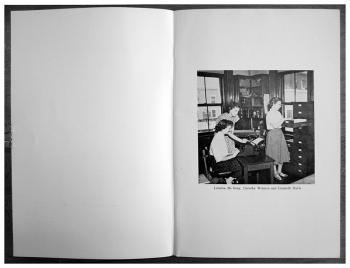 The inside cover of an annual report from the 1950s shows city staff members at work. Photographs, initially of public works and workers, and later of civic life and scenery, became increasingly common in later copies of the annual report.
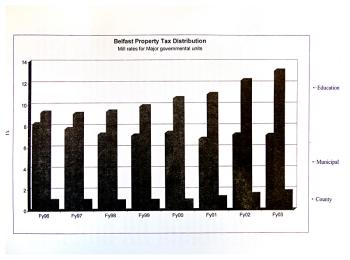 In recent years, city officials used graphics like this one to distance themselves from county and school district budgets, which factor in local tax rates but are outside of city control.
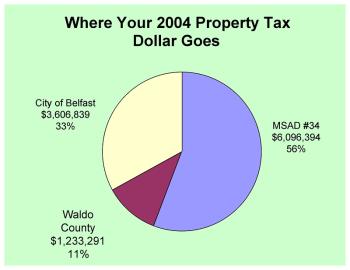 The title and pie chart format of a 2004 graphic distributed within City Hall echo the one from 1930-31, but with the contemporary focus on city, county and school taxes.
BELFAST - At the end of his first year on the job, Harrie D. Eckler, Belfast's first city manager, summed up the perennial public relations puzzle of government officials in a single sentence, which was printed in the city's 1930-31 annual report. It read:
During the time that taxes are being paid, the question usually arises as to why the tax is so high, and what the money raised by taxation is used for.
The statement wouldn't have been news to anyone. But the presentation, which included a pie chart illustrating the distribution of tax revenues under the heading "Where Your Tax Dollar Goes," was clearly designed to tell the story in a way that the city's previously-unillustrated reports hadn't been able to do.
Schools, police and fire, debt, paupers and health and other departments all got their slice of the pie in a way that could be digested at a glance. In a similar spirit of transparency, the inside cover of the same report included an organizational chart of city government, topped by a large block marked "voters."
Whether the new manager was trying to empower residents, deflect criticism from the community or show the value of his new office, the use of visuals became standard practice in the city's annual reports.
Bar graphs were employed to show a drop in bonded indebtedness or a spike in school expenditures. Maps illustrated which roads had been improved or built in the past year. Photos, used first in 1935, initially showed off new public works and put faces to public workers, and later showed scenes of civic life in a way that suggested a travel brochure.
But it was Eckler's "question" that most often sent city officials back to the drawing board, literally, and sometimes with odd results.
An annual report, as it turns out, is a tough venue for creativity.
A section from 1952-53, for example, shows the perils of talking frankly about taxes.
The 12-page breakdown of city expenditures that opens the report starts with the reassuring statement "Taxation should not cause vexation," then proceeds show how various city services contribute to the total tax rate of $74 per $1,000 of property value.
If the grand total (the tax rate today is around $20) wasn't vexing to residents all by itself, the gradually increasing type size used for the running total and the inducement to "WATCH YOUR TAX RATE GROW" probably didn't help make the case.
But even in their clumsiest attempts, city officials were clearly using graphics to communicate something about what government was doing.
After the millenium a common theme was the split between municipal, county and school taxes. The city collects taxes for all three and as a consequence was the first to hear about it when the tax rate went up, even if it was the result of an increased county or school budget. In these years, the underlying message seemed to be something like: Don't blame us.
Belfast stopped printing annual reports in 2005. Unlike smaller municipalities where the document continues to be the central document of the annual town meeting, the city version ceased to have an obvious venue.
The gallery at right shows selections of graphics from the Belfast's annual reports from 1931 to 2004 reproduced from archives at the Belfast Free Library and City Hall.
Contact Ethan Andrews by e-mail at news@penbaypilot.com
Event Date
Address
United States

